
Page 118 - Boiler plant and distribution system optimization manual
P. 118
Boiler Tuneup 103
Since most boilers operate over a reasonably posits generally accumulate. The SSN is directly
broad range, tests must be run at several firing related to excess-oxygen levels and burner per-
rates to determine the minimum excess-oxygen formance.
level for each. Only then can the combustion-con-
trol system be tuned for optimum fuel economy.
At each firing rate investigated, excess ox- MINIMUM ExCESS OxYGEN
ygen in the flue gas should be varied from 1-2%
above the normal operating point down to where A proven method for determining the mini-
the boiler just starts to smoke, or to where CO mum amount of excess oxygen required for com-
emissions vary between 150 to 250 Parts per mil- bustion involves developing curves similar to the
lion (PPM). The level of 400 PPM is the legal limit smoke/oxygen and CO/oxygen curves shown
established in many states and by insurance com- in Figures 9.28 and 9.29. Based on test measure-
panies. This condition is referred to as the smoke ments, these curves show how boiler smoke and
or CO threshold, or simply as the minimum oxy- CO levels change as excess oxygen is varied.
gen point. Each of these figures depicts two distinct
The smoke threshold generally applies to curves, illustrating the extremes in smoke and CO
coal and oil firing, because smoking usually oc- behavior that may be encountered. One curve ex-
curs before CO emissions reach significant levels. hibits a very gradual increase in CO or smoke as
The CO level pertains to gaseous fuels. The smoke the minimum excess oxygen condition is reached.
threshold for solid and liquid fuels represents the The other has a gradual slope at relatively high
lowest possible excess-oxygen level at which ac- oxygen levels and a steep slope near the mini-
ceptable stack conditions can be maintained. mum oxygen point. For cases represented by this
The Smoke Spot Number (SSN) is a scale of second curve, unpredictably high levels of smoke
smoke density which can be related to the soot and CO, or potentially unstable conditions, can
accumulation in a boiler Figure 9.26 shows the occur with very small changes in excess air.
desirable SSN for various fuels. Figure 9.27 shows Caution is required when reducing air flow
the relationship of SSN to the rate at which de- near the smoke point or CO threshold. Care-
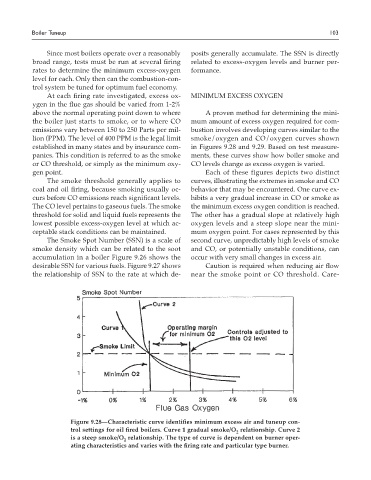
Figure 9.28—Characteristic curve identifies minimum excess air and tuneup con-
trol settings for oil fired boilers. Curve 1 gradual smoke/O relationship. Curve 2
2
is a steep smoke/O relationship. The type of curve is dependent on burner oper-
2
ating characteristics and varies with the firing rate and particular type burner.