
Page 119 - Boiler plant and distribution system optimization manual
P. 119
104 Boiler Plant and Distribution System Optimization Manual
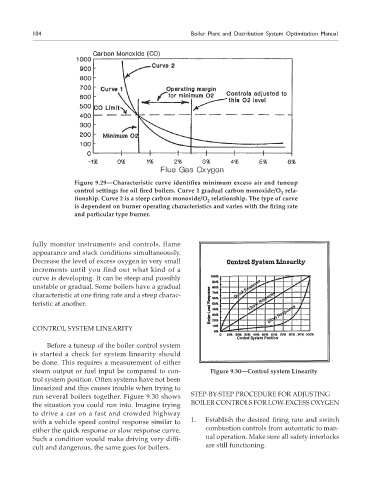
Figure 9.29—Characteristic curve identifies minimum excess air and tuneup
control settings for oil fired boilers. Curve 1 gradual carbon monoxide/O rela-
2
tionship. Curve 2 is a steep carbon monoxide/O relationship. The type of curve
2
is dependent on burner operating characteristics and varies with the firing rate
and particular type burner.
fully monitor instruments and controls, flame
appearance and stack conditions simultaneously.
Decrease the level of excess oxygen in very small
increments until you find out what kind of a
curve is developing. It can be steep and possibly
unstable or gradual. Some boilers have a gradual
characteristic at one firing rate and a steep charac-
teristic at another.
CONTROL SYSTEM LINEARITY
Before a tuneup of the boiler control system
is started a check for system linearity should
be done. This requires a measurement of either
steam output or fuel input be compared to con- Figure 9.30—Control system Linearity
trol system position. Often systems have not been
linearized and this causes trouble when trying to
run several boilers together. Figure 9.30 shows STEP-BY-STEP PROCEDURE FOR ADJUSTING
the situation you could run into. Imagine trying BOILER CONTROLS FOR LOW-ExCESS OxYGEN
to drive a car on a fast and crowded highway
with a vehicle speed control response similar to 1. Establish the desired firing rate and switch
either the quick response or slow response curve. combustion controls from automatic to man-
Such a condition would make driving very diffi- ual operation. Make sure all safety interlocks
cult and dangerous, the same goes for boilers. are still functioning.