
Page 95 - Building A Succesful Board-Test Strategy
P. 95
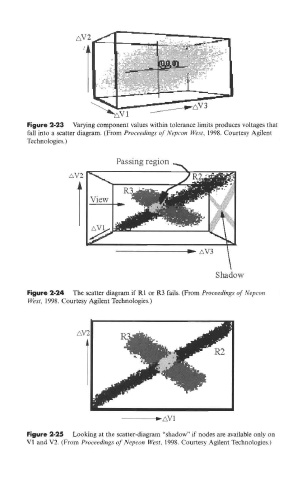
Figure 2-23  Varying component values within tolerance limits produces voltages that
 fall into a scatter diagram. (From Proceedings of Nepcon West, 1998. Courtesy Agilent
 Technologies.)


 Figure 2-24  The scatter diagram if R1 or R3 fails. (From Proceedings of Nepcon
 West, 1998. Courtesy Agilent Technologies.)


 Figure 2-25  Looking at the scatter-diagram "shadow" if nodes are available only on
 V1 and V2. (From Proceedings of Nepcon West, 1998. Courtesy Agilent Technologies.)