
Page 187 - Calculus Workbook For Dummies
P. 187
171
Chapter 9: Getting into Integration
Solutions to Getting into Integration
a a. Estimate the area under f x = lnx from 1 to 6, but this time with 10 left rectangles. The area
^ h
is 5.285.
1. Sketch a graph and divide the intervals into 10 subintervals.
2. a. Draw the first left rectangle by putting your pen at the left end of the first base (that’s at
x = 1) and going straight up till you hit the function.
Whoops. You’re already on the function at x = 1, right? So, guess what? There is no first
rectangle — or you could say it’s a rectangle with a height of zero and an area of zero.
b. Draw the “second” rectangle by putting your pen at x = 1.5, going straight up till you hit
f x = lnx, then go right till you’re directly above x = 2, then down to the x-axis. See the
^ h
following figure.
y
2 f(x) = ln(x)
1
2
1 3
x
1 2 3 4 5 6
R2
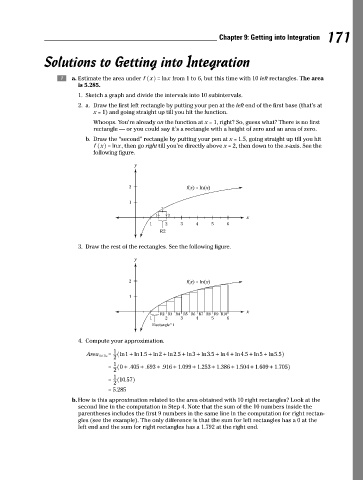
3. Draw the rest of the rectangles. See the following figure.
y
2 f(x) = ln(x)
1
x
R2 R3 R4 R5 R6 R7 R8 R9 R10
1 2 3 4 5 6
ìRectangle” 1
4. Compute your approximation.
1
LRs = ^ ln1 + ln1 .5 + ln2 + ln2 .5 + ln3 + ln3 .5 + ln4 + ln4 .5 + ln5 + ln5 .5h
2
Area 10
1
= ^ 0 + .405 + .693 + .916 + . 1 099 + . 1 253 + . 1 386 + . 1 504 + . 1 609 + . 1 705h
2
1
= ^ 10 .57h
2
= . 5 285
b. How is this approximation related to the area obtained with 10 right rectangles? Look at the
second line in the computation in Step 4. Note that the sum of the 10 numbers inside the
parentheses includes the first 9 numbers in the same line in the computation for right rectan-
gles (see the example). The only difference is that the sum for left rectangles has a 0 at the
left end and the sum for right rectangles has a 1.792 at the right end.