
Page 188 - Calculus Workbook For Dummies
P. 188
172 Part IV: Integration and Infinite Series
If you look at the figure in Step 2 of the example and at the figure in Step 3 of the solution to
1(a), you’ll see why this works out this way. The first rectangle in the example figure is identical
to the second rectangle in the solution 1(a) figure. The second rectangle in the example figure
is identical to the third rectangle in the solution 1(a) figure, and so on. The only difference is
that the solution 1(a) figure contains the left-most “rectangle” (the invisible one) and the exam-
ple figure contains the tall, right-most rectangle.
A left-rectangle sum and a right-rectangle sum will always differ by an amount equal to the dif-
ference in area of the left-most left rectangle and the right-most right rectangle. (Memorize this
paragraph and recite it in class — with your right index finger pointed upward for effect. You’ll
instantly become a babe (dude) magnet.)
b Approximate the same area again with 10 midpoint rectangles. The approximate area is 5.759.
1. Sketch your curve and the 10 subintervals again.
2. Compute the midpoints of the bases of all rectangles. This should be a no-brainer: 1.25, 1.75,
2.25 . . . 5.75.
3. Draw the first rectangle. Start on the point on f x = lnx directly above x = 1.25, then go left
^ h
till you’re above x = 1 and right till you’re above x = 1.5, then down from both these points to
make the two sides.
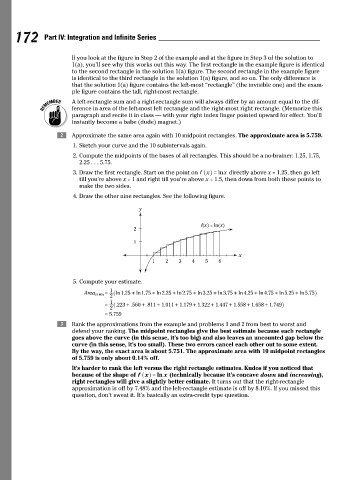
4. Draw the other nine rectangles. See the following figure.
y
f(x) = ln(x)
2
1
x
1 2 3 4 5 6
5. Compute your estimate.
1
MRs = ^ ln . 1 25 + ln . 1 75 + ln . 2 25 + ln . 2 75 + ln . 3 25 + ln . 3 75 + ln . 4 25 + ln . 4 75 + ln . 5 25 + ln . 5 75h
Area 10
2
1
= ^ .223 + .560 + .811 + . 1 011 + . 1 179 + . 1 322 + . 1 447 + . 1 558 + . 1 658 + . 1 749h
2
= . 5 759
c Rank the approximations from the example and problems 1 and 2 from best to worst and
defend your ranking. The midpoint rectangles give the best estimate because each rectangle
goes above the curve (in this sense, it’s too big) and also leaves an uncounted gap below the
curve (in this sense, it’s too small). These two errors cancel each other out to some extent.
By the way, the exact area is about 5.751. The approximate area with 10 midpoint rectangles
of 5.759 is only about 0.14% off.
It’s harder to rank the left versus the right rectangle estimates. Kudos if you noticed that
because of the shape of f x = ln x (technically because it’s concave down and increasing),
^ h
right rectangles will give a slightly better estimate. It turns out that the right-rectangle
approximation is off by 7.48% and the left-rectangle estimate is off by 8.10%. If you missed this
question, don’t sweat it. It’s basically an extra-credit type question.