
Page 310 - Cam Design Handbook
P. 310
THB10 9/19/03 7:28 PM Page 298
298 CAM DESIGN HANDBOOK
The last two procedures of inspecting the cam contour obtain the cam-follower accelera-
tion curve and both can be compared with each other as a check. It should be acknowl-
edged that measuring the cam profile and applying finite differences, Johnson (1995), is
somewhat costly and time-consuming. Applying the method of finite differences, we can
establish the acceleration effect of simple profile inaccuracies. The acceleration of any
point b midway between two other points a and c as a small angle interval Dq is
Ê w ˆ 2
˙˙ y @ ( y + y - 2 y ) in sec 2 (10.2)
b Ë D q ¯ a c b
where y = follower displacement, in
s = error or deviation from the theoretical cam profile, in
w = cam speed rad/sec
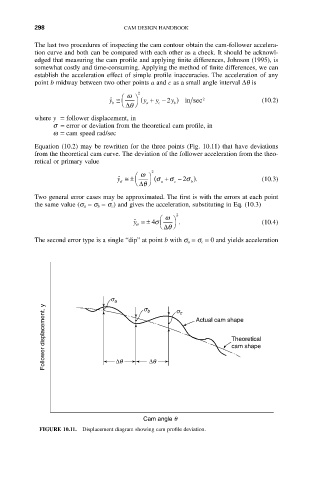
Equation (10.2) may be rewritten for the three points (Fig. 10.11) that have deviations
from the theoretical cam curve. The deviation of the follower acceleration from the theo-
retical or primary value
Ê w ˆ 2
˙˙ y @± ( s + s - 2 s . ) (10.3)
s Ë D q ¯ a c b
Two general error cases may be approximated. The first is with the errors at each point
the same value (s a = s b = s c) and gives the acceleration, substituting in Eq. (10.3)
Ê w ˆ 2
˙˙ y @± 4 s . (10.4)
s Ë D q ¯
The second error type is a single “dip” at point b with s a = s c = 0 and yields acceleration
s a s b s c
Follower displacement, y Dq Dq Actual cam shape
Theoretical
cam shape
Cam angle q
FIGURE 10.11. Displacement diagram showing cam profile deviation.