Page 311 - Cam Design Handbook
P. 311
THB10  9/19/03  7:28 PM  Page 299

                                     CAM MANUFACTURING                     299


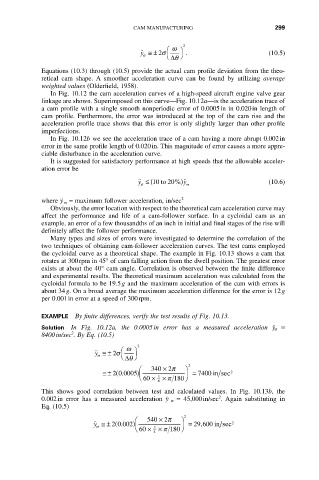
                                              Ê  w  ˆ  2
                                       ˙˙ y @± 2 s  .                     (10.5)
                                        s     Ë  D q  ¯
            Equations (10.3) through (10.5) provide the actual cam profile deviation from the theo-
            retical  cam  shape.  A smoother  acceleration  curve  can  be  found  by  utilizing  average
            weighted values (Olderfield, 1958).
               In Fig. 10.12 the cam acceleration curves of a high-speed aircraft engine valve gear
            linkage are shown. Superimposed on this curve—Fig. 10.12a—is the acceleration trace of
            a cam profile with a single smooth nonperiodic error of 0.0005in in 0.020in length of
            cam  profile.  Furthermore,  the  error  was  introduced  at  the  top  of  the  cam  rise  and  the
            acceleration profile trace shows that this error is only slightly larger than other profile
            imperfections.
               In Fig. 10.12b we see the acceleration trace of a cam having a more abrupt 0.002in
            error in the same profile length of 0.020in. This magnitude of error causes a more appre-
            ciable disturbance in the acceleration curve.
               It is suggested for satisfactory performance at high speeds that the allowable acceler-
            ation error be
                                      ˙˙ y £ (1020to  % ˙˙ y )            (10.6)
                                       s           m
            where y m = maximum follower acceleration, in/sec 2
                 ¨
               Obviously, the error location with respect to the theoretical cam acceleration curve may
            affect  the  performance  and  life  of  a  cam-follower  surface.  In  a  cycloidal  cam  as  an
            example, an error of a few thousandths of an inch in initial and final stages of the rise will
            definitely affect the follower performance.
               Many types and sizes of errors were investigated to determine the correlation of the
            two techniques of obtaining cam-follower acceleration curves. The test cams employed
            the cycloidal curve as a theoretical shape. The example in Fig. 10.13 shows a cam that
            rotates at 300rpm in 45° of cam falling action from the dwell position. The greatest error
            exists at about the 40° cam angle. Correlation is observed between the finite difference
            and experimental results. The theoretical maximum acceleration was calculated from the
            cycloidal formula to be 19.5g and the maximum acceleration of the cam with errors is
            about 34g. On a broad average the maximum acceleration difference for the error is 12g
            per 0.001in error at a speed of 300rpm.

            EXAMPLE By finite differences, verify the test results of Fig. 10.13.
                                                                           ¨
            Solution  In  Fig.  10.12a,  the  0.0005in  error  has  a  measured  acceleration  y s =
                    2
            8400in/sec . By Eq. (10.5)
                                  Ê  w  ˆ  2
                           ˙˙ y @± 2 s
                           s      Ë  D q  ¯
                                                    2
                                             ¥
                                       Ê  3402 p   ˆ
                             @± ( 2  . 0 0005 )Á   ˜ = 7400 in  sec  2
                                          ¥
                                            3
                                             ¥
                                              p
                                       Ë 60180     ¯
                                            4
            This  shows  good  correlation  between  test  and  calculated  values.  In  Fig.  10.13b,  the
                                                            2
            0.002in  error  has  a  measured  acceleration  y s = 45,000in/sec .  Again  substituting  in
                                              ¨
            Eq. (10.5)
                                            ¥
                                      Ê  5402 p   ˆ  2
                          ˙˙ y @± ( 2 0 .002 )Á   ˜ = 29 ,600 in  sec  2
                           s               3
                                            ¥
                                             p
                                         ¥
                                      Ë 60180     ¯
                                           4

