
Page 103 - Chalcogenide Glasses for Infrared Optics
P. 103
Glass Pr oduction 81
TI
10 × S As Se 20 TI
3
1173
TI 20 data
2
10 × TI 1173 data Sb
Vapor pressure (torr) 10 ×
1
10 ×
0
10 ×
–1
200 400 600 800 1000 1200 1400 1600
Temperature (°C)
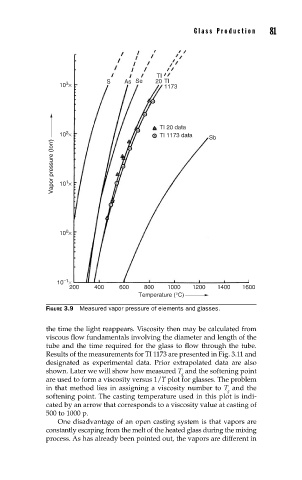
FIGURE 3.9 Measured vapor pressure of elements and glasses.
the time the light reappears. Viscosity then may be calculated from
viscous flow fundamentals involving the diameter and length of the
tube and the time required for the glass to flow through the tube.
Results of the measurements for TI 1173 are presented in Fig. 3.11 and
designated as experimental data. Prior extrapolated data are also
shown. Later we will show how measured T and the softening point
g
are used to form a viscosity versus 1/T plot for glasses. The problem
in that method lies in assigning a viscosity number to T and the
g
softening point. The casting temperature used in this plot is indi-
cated by an arrow that corresponds to a viscosity value at casting of
500 to 1000 p.
One disadvantage of an open casting system is that vapors are
constantly escaping from the melt of the heated glass during the mixing
process. As has already been pointed out, the vapors are different in