
Page 126 - Chalcogenide Glasses for Infrared Optics
P. 126
Characterization of Glass Pr operties 103
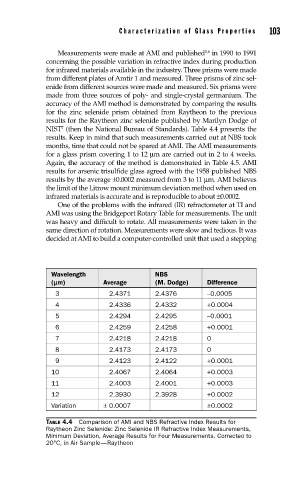
Measurements were made at AMI and published in 1990 to 1991
5,6
concerning the possible variation in refractive index during production
for infrared materials available in the industry. Three prisms were made
from different plates of Amtir 1 and measured. Three prisms of zinc sel-
enide from different sources were made and measured. Six prisms were
made from three sources of poly- and single-crystal germanium. The
accuracy of the AMI method is demonstrated by comparing the results
for the zinc selenide prism obtained from Raytheon to the previous
results for the Raytheon zinc selenide published by Marilyn Dodge of
7
NIST (then the National Bureau of Standards). Table 4.4 presents the
results. Keep in mind that such measurements carried out at NBS took
months, time that could not be spared at AMI. The AMI measurements
for a glass prism covering 1 to 12 µm are carried out in 2 to 4 weeks.
Again, the accuracy of the method is demonstrated in Table 4.5. AMI
results for arsenic trisulfide glass agreed with the 1958 published NBS
results by the average ±0.0002 measured from 3 to 11 µm. AMI believes
the limit of the Litrow mount minimum deviation method when used on
infrared materials is accurate and is reproducible to about ±0.0002.
One of the problems with the infrared (IR) refractometer at TI and
AMI was using the Bridgeport Rotary Table for measurements. The unit
was heavy and difficult to rotate. All measurements were taken in the
same direction of rotation. Measurements were slow and tedious. It was
decided at AMI to build a computer-controlled unit that used a stepping
Wavelength NBS
(mm) Average (M. Dodge) Difference
3 2.4371 2.4376 –0.0005
4 2.4336 2.4332 +0.0004
5 2.4294 2.4295 –0.0001
6 2.4259 2.4258 +0.0001
7 2.4218 2.4218 0
8 2.4173 2.4173 0
9 2.4123 2.4122 +0.0001
10 2.4067 2.4064 +0.0003
11 2.4003 2.4001 +0.0003
12 2.3930 2.3928 +0.0002
Variation ± 0.0007 ±0.0002
TABLE 4.4 Comparison of AMI and NBS Refractive Index Results for
Raytheon Zinc Selenide: Zinc Selenide IR Refractive Index Measurements,
Minimum Deviation, Average Results for Four Measurements, Corrected to
20°C, in Air Sample—Raytheon