
Page 80 - Chalcogenide Glasses for Infrared Optics
P. 80
58 Cha pte r T w o
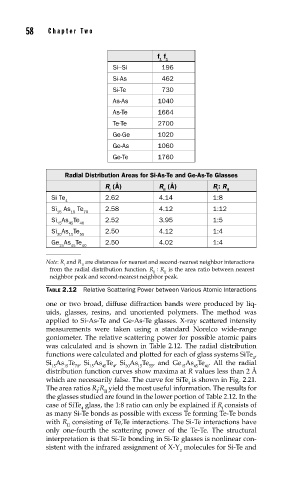
f f
1 1
Si–Si 196
Si-As 462
Si-Te 730
As-As 1040
As-Te 1664
Te-Te 2700
Ge-Ge 1020
Ge-As 1060
Ge-Te 1760
Radial Distribution Areas for Si-As-Te and Ge-As-Te Glasses
R (Å) R (Å) R : R
I II I II
Si Te 2.62 4.14 1:8
4
Si As Te 2.58 4.12 1:12
15 15 70
Si As Te 2.52 3.95 1:5
15 45 40
Si As Te 2.50 4.12 1:4
30 15 55
Ge As Te 2.50 4.02 1:4
15 45 40
Note: R and R are distances for nearest and second-nearest neighbor interactions
I II
from the radial distribution function. R : R is the area ratio between nearest
I II
neighbor peak and second-nearest neighbor peak.
TABLE 2.12 Relative Scattering Power between Various Atomic Interactions
one or two broad, diffuse diffraction bands were produced by liq-
uids, glasses, resins, and unoriented polymers. The method was
applied to Si-As-Te and Ge-As-Te glasses. X-ray scattered intensity
measurements were taken using a standard Norelco wide-range
goniometer. The relative scattering power for possible atomic pairs
was calculated and is shown in Table 2.12. The radial distribution
functions were calculated and plotted for each of glass systems SiTe ,
4
Si As Te , Si As Te , Si As Te , and Ge As Te . All the radial
15 15 70 15 45 4 30 15 55 15 45 40
distribution function curves show maxima at R values less than 2 Å
which are necessarily false. The curve for SiTe is shown in Fig. 2.21.
4
The area ratios R :R yield the most useful information. The results for
I II
the glasses studied are found in the lower portion of Table 2.12. In the
case of SiTe glass, the 1:8 ratio can only be explained if R consists of
4 I
as many Si-Te bonds as possible with excess Te forming Te-Te bonds
with R consisting of Te,Te interactions. The Si-Te interactions have
II
only one-fourth the scattering power of the Te-Te. The structural
interpretation is that Si-Te bonding in Si-Te glasses is nonlinear con-
sistent with the infrared assignment of X-Y molecules for Si-Te and
2