
Page 335 - Classification Parameter Estimation & State Estimation An Engg Approach Using MATLAB
P. 335
324 WORKED OUT EXAMPLES
thresholding the waveform
max(w)
T
τ
thres
8.5 9 9.5 10
t (ms)
thresholding the envelope
max(w)
T
τ
thres
8.5 9 9.5 10
t (ms)
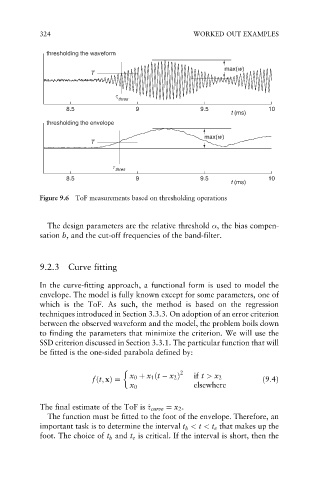
Figure 9.6 ToF measurements based on thresholding operations
The design parameters are the relative threshold , the bias compen-
sation b, and the cut-off frequencies of the band-filter.
9.2.3 Curve fitting
In the curve-fitting approach, a functional form is used to model the
envelope. The model is fully known except for some parameters, one of
which is the ToF. As such, the method is based on the regression
techniques introduced in Section 3.3.3. On adoption of an error criterion
between the observed waveform and the model, the problem boils down
to finding the parameters that minimize the criterion. We will use the
SSD criterion discussed in Section 3.3.1. The particular function that will
be fitted is the one-sided parabola defined by:
2
x 0 þ x 1 ðt x 2 Þ if t > x 2
fðt; xÞ¼ ð9:4Þ
x 0 elsewhere
t
The final estimate of the ToF is ^ t curve ¼ x 2 .
The function must be fitted to the foot of the envelope. Therefore, an
important task is to determine the interval t b < t < t e that makes up the
foot. The choice of t b and t e is critical. If the interval is short, then the