
Page 144 - Computational Modeling in Biomedical Engineering and Medical Physics
P. 144
Electrical activity of the heart 133
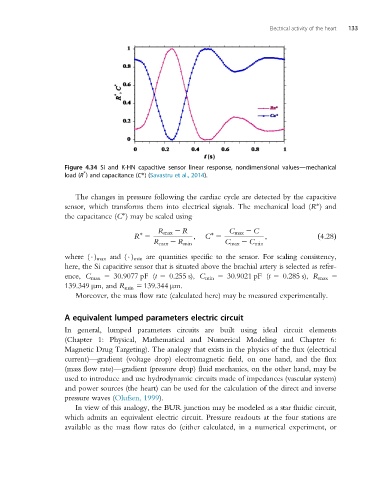
Figure 4.34 Si and K-HN capacitive sensor linear response, nondimensional values—mechanical
T
load (R ) and capacitance (CT)(Savastru et al., 2014).
The changes in pressure following the cardiac cycle are detected by the capacitive
sensor, which transforms them into electrical signals. The mechanical load (R ) and
the capacitance (C ) may be scaled using
R max 2 R C max 2 C
R 5 ; C 5 ; ð4:28Þ
R max 2 R min C max 2 C min
where ( ) max and ( ) min are quantities specific to the sensor. For scaling consistency,
here, the Si capacitive sensor that is situated above the brachial artery is selected as refer-
ence, C max 5 30.9077 pF (t 5 0.255 s), C min 5 30.9021 pF (t 5 0.285 s), R max 5
139.349 μm, and R min 5139.344 μm.
Moreover, the mass flow rate (calculated here) may be measured experimentally.
A equivalent lumped parameters electric circuit
In general, lumped parameters circuits are built using ideal circuit elements
(Chapter 1: Physical, Mathematical and Numerical Modeling and Chapter 6:
Magnetic Drug Targeting). The analogy that exists in the physics of the flux (electrical
current)—gradient (voltage drop) electromagnetic field, on one hand, and the flux
(mass flow rate)—gradient (pressure drop) fluid mechanics, on the other hand, may be
used to introduce and use hydrodynamic circuits made of impedances (vascular system)
and power sources (the heart) can be used for the calculation of the direct and inverse
pressure waves (Olufsen, 1999).
In view of this analogy, the BUR junction may be modeled as a star fluidic circuit,
which admits an equivalent electric circuit. Pressure readouts at the four stations are
available as the mass flow rates do (either calculated, in a numerical experiment, or