
Page 141 - Computational Modeling in Biomedical Engineering and Medical Physics
P. 141
130 Computational Modeling in Biomedical Engineering and Medical Physics
Figure 4.28 (A) Maximum flow rate, at t 5 0.25 s. (B) Minimum flow rate, at t 5 0.5 s. The hemody-
namic of the BUR system at—oscillating recirculation cells are observed at the entrance in the
radial and ulnar arteries (Morega et al., 2013).
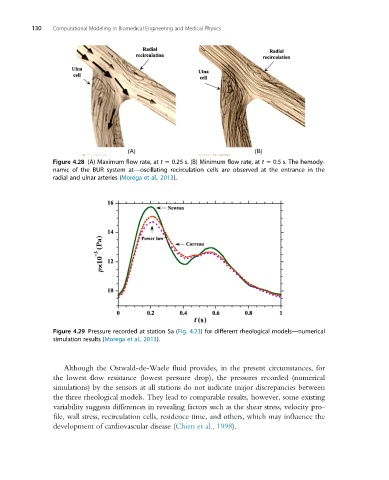
Figure 4.29 Pressure recorded at station Sa (Fig. 4.23) for different rheological models—numerical
simulation results (Morega et al., 2013).
Although the Ostwald-de-Waele fluid provides, in the present circumstances, for
the lowest flow resistance (lowest pressure drop), the pressures recorded (numerical
simulations) by the sensors at all stations do not indicate major discrepancies between
the three rheological models. They lead to comparable results, however, some existing
variability suggests differences in revealing factors such as the shear stress, velocity pro-
file, wall stress, recirculation cells, residence time, and others, which may influence the
development of cardiovascular disease (Chien et al., 1998).