
Page 140 - Computational Modeling in Biomedical Engineering and Medical Physics
P. 140
Electrical activity of the heart 129
Sa Transducers
S0
Sb Sc
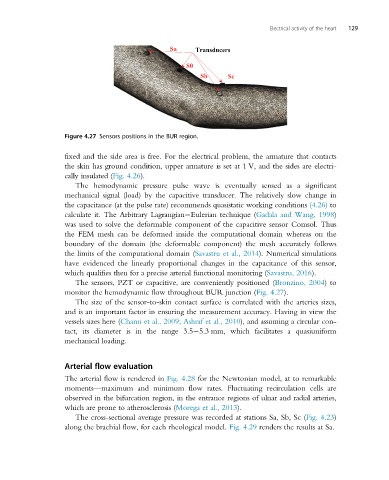
Figure 4.27 Sensors positions in the BUR region.
fixed and the side area is free. For the electrical problem, the armature that contacts
the skin has ground condition, upper armature is set at 1 V, and the sides are electri-
cally insulated (Fig. 4.26).
The hemodynamic pressure pulse wave is eventually sensed as a significant
mechanical signal (load) by the capacitive transducer. The relatively slow change in
the capacitance (at the pulse rate) recommends quasistatic working conditions (4.26) to
calculate it. The Arbitrary Lagrangian Eulerian technique (Gadala and Wang, 1998)
was used to solve the deformable component of the capacitive sensor Comsol. Thus
the FEM mesh can be deformed inside the computational domain whereas on the
boundary of the domain (the deformable component) the mesh accurately follows
the limits of the computational domain (Savastru et al., 2014). Numerical simulations
have evidenced the linearly proportional changes in the capacitance of this sensor,
which qualifies then for a precise arterial functional monitoring (Savastru, 2016).
The sensors, PZT or capacitive, are conveniently positioned (Bronzino, 2004)to
monitor the hemodynamic flow throughout BUR junction (Fig. 4.27).
The size of the sensor-to-skin contact surface is correlated with the arteries sizes,
and is an important factor in ensuring the measurement accuracy. Having in view the
vessels sizes here (Chami et al., 2009; Ashraf et al., 2010), and assuming a circular con-
tact, its diameter is in the range 3.5 5.3 mm, which facilitates a quasiuniform
mechanical loading.
Arterial flow evaluation
The arterial flow is rendered in Fig. 4.28 for the Newtonian model, at to remarkable
moments—maximum and minimum flow rates. Fluctuating recirculation cells are
observed in the bifurcation region, in the entrance regions of ulnar and radial arteries,
which are prone to atherosclerosis (Morega et al., 2013).
The cross-sectional average pressure was recorded at stations Sa, Sb, Sc (Fig. 4.23)
along the brachial flow, for each rheological model. Fig. 4.29 renders the results at Sa.