
Page 249 - Computational Modeling in Biomedical Engineering and Medical Physics
P. 249
238 Computational Modeling in Biomedical Engineering and Medical Physics
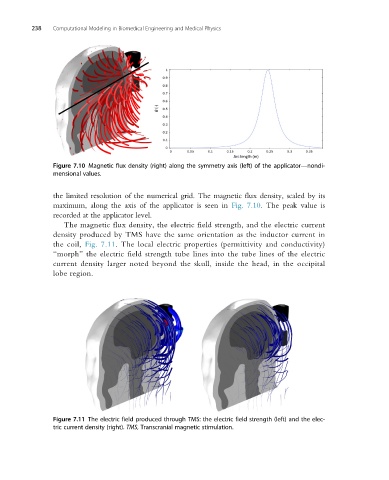
Figure 7.10 Magnetic flux density (right) along the symmetry axis (left) of the applicator—nondi-
mensional values.
the limited resolution of the numerical grid. The magnetic flux density, scaled by its
maximum, along the axis of the applicator is seen in Fig. 7.10. The peak value is
recorded at the applicator level.
The magnetic flux density, the electric field strength, and the electric current
density produced by TMS have the same orientation as the inductor current in
the coil, Fig. 7.11. The local electric properties (permittivity and conductivity)
“morph” the electric field strength tube lines into the tube lines of the electric
current density larger noted beyond the skull, inside the head, in the occipital
lobe region.
Figure 7.11 The electric field produced through TMS: the electric field strength (left) and the elec-
tric current density (right). TMS, Transcranial magnetic stimulation.