
Page 94 - Computational Modeling in Biomedical Engineering and Medical Physics
P. 94
82 Computational Modeling in Biomedical Engineering and Medical Physics
(A) (B) (C)
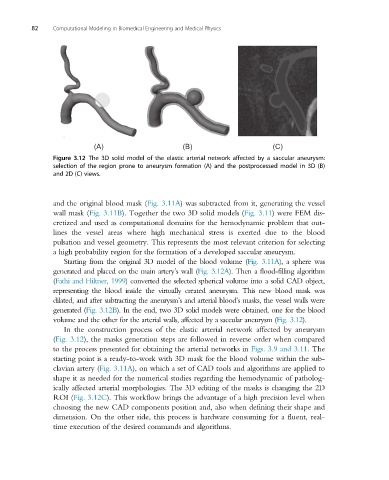
Figure 3.12 The 3D solid model of the elastic arterial network affected by a saccular aneurysm:
selection of the region prone to aneurysm formation (A) and the postprocessed model in 3D (B)
and 2D (C) views.
and the original blood mask (Fig. 3.11A) was subtracted from it, generating the vessel
wall mask (Fig. 3.11B). Together the two 3D solid models (Fig. 3.11) were FEM dis-
cretized and used as computational domains for the hemodynamic problem that out-
lines the vessel areas where high mechanical stress is exerted due to the blood
pulsation and vessel geometry. This represents the most relevant criterion for selecting
a high probability region for the formation of a developed saccular aneurysm.
Starting from the original 3D model of the blood volume (Fig. 3.11A), a sphere was
generated and placed on the main artery’swall(Fig. 3.12A). Then a flood-filling algorithm
(Fathi and Hiltner, 1999) converted the selected spherical volume into a solid CAD object,
representing the blood inside the virtually created aneurysm. This new blood mask was
dilated, and after subtracting the aneurysm’s and arterial blood’s masks, the vessel walls were
generated (Fig. 3.12B). In the end, two 3D solid models were obtained, one for the blood
volume and the other for the arterial walls, affected by a saccular aneurysm (Fig. 3.12).
In the construction process of the elastic arterial network affected by aneurysm
(Fig. 3.12), the masks generation steps are followed in reverse order when compared
to the process presented for obtaining the arterial networks in Figs. 3.9 and 3.11. The
starting point is a ready-to-work with 3D mask for the blood volume within the sub-
clavian artery (Fig. 3.11A), on which a set of CAD tools and algorithms are applied to
shape it as needed for the numerical studies regarding the hemodynamic of patholog-
ically affected arterial morphologies. The 3D editing of the masks is changing the 2D
ROI (Fig. 3.12C). This workflow brings the advantage of a high precision level when
choosing the new CAD components position and, also when defining their shape and
dimension. On the other side, this process is hardware consuming for a fluent, real-
time execution of the desired commands and algorithms.