
Page 93 - Computational Modeling in Biomedical Engineering and Medical Physics
P. 93
Computational domains 81
(A) (B)
Figure 3.10 Segmentation of the left subclavian artery (B) using an MRI image set (A).
To generate a 3D solid model for an elastic arterial network affected by a saccular
aneurysm, an MRI-acquired DICOM dataset (Fig. 3.10A) for the thoracic region of a
healthy subject was used to segment a region of the left subclavian artery. Because the
image set did not contain any pathological formations, this was created using a lucrative
alternation between a flood-fill tool and a CAD primitives generation algorithm (Sun
et al., 2005;Maetal.,2011). After finishing the segmentation process of the targeted
arterial network (Fig. 3.10B), a prone to aneurysm formation region of the arterial wall
was searched for. This was judged after the numerical simulation results given by the
model that implements the normal elastic arterial branch as computational domain
(Fig. 3.11) and accounts for the presence of pulsatile blood flow structural interaction.
The ROI reconstruction of the blood volume that flows within the subclavian
artery was achieved by applying a threshold algorithm (Vincent, 1993). After removing
the 3D artifacts and undesired regions, a smoothing (Kuan et al., 1985) was configured
and applied several times to generate the result presented in Fig. 3.11A. The postpro-
cessed blood volume mask was dilated by a morphological algorithm (Roushdy, 2006)
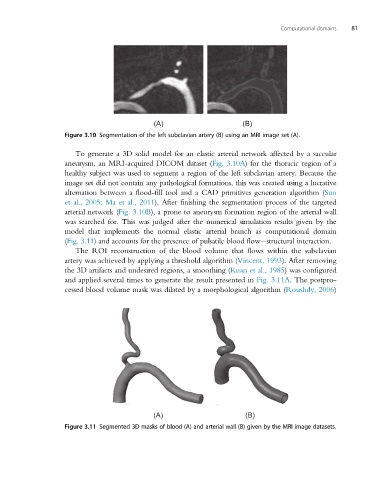
(A) (B)
Figure 3.11 Segmented 3D masks of blood (A) and arterial wall (B) given by the MRI image datasets.