
Page 204 - Computational Retinal Image Analysis
P. 204
200 CHAPTER 11 Structure-preserving guided retinal image filtering
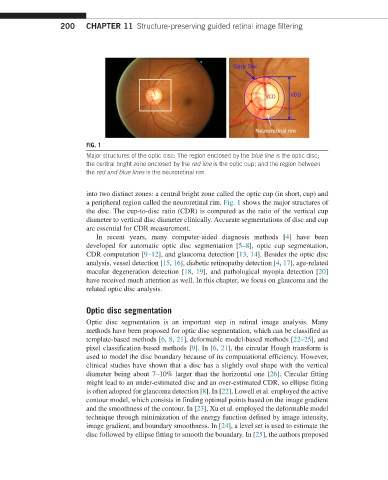
FIG. 1
Major structures of the optic disc: The region enclosed by the blue line is the optic disc;
the central bright zone enclosed by the red line is the optic cup; and the region between
the red and blue lines is the neuroretinal rim.
into two distinct zones: a central bright zone called the optic cup (in short, cup) and
a peripheral region called the neuroretinal rim. Fig. 1 shows the major structures of
the disc. The cup-to-disc ratio (CDR) is computed as the ratio of the vertical cup
diameter to vertical disc diameter clinically. Accurate segmentations of disc and cup
are essential for CDR measurement.
In recent years, many computer-aided diagnosis methods [4] have been
developed for automatic optic disc segmentation [5–8], optic cup segmentation,
CDR computation [9–12], and glaucoma detection [13, 14]. Besides the optic disc
analysis, vessel detection [15, 16], diabetic retinopathy detection [4, 17], age-related
macular degeneration detection [18, 19], and pathological myopia detection [20]
have received much attention as well. In this chapter, we focus on glaucoma and the
related optic disc analysis.
Optic disc segmentation
Optic disc segmentation is an important step in retinal image analysis. Many
methods have been proposed for optic disc segmentation, which can be classified as
template-based methods [6, 8, 21], deformable model-based methods [22–25], and
pixel classification-based methods [9]. In [6, 21], the circular Hough transform is
used to model the disc boundary because of its computational efficiency. However,
clinical studies have shown that a disc has a slightly oval shape with the vertical
diameter being about 7–10% larger than the horizontal one [26]. Circular fitting
might lead to an under-estimated disc and an over-estimated CDR, so ellipse fitting
is often adopted for glaucoma detection [8]. In [22], Lowell et al. employed the active
contour model, which consists in finding optimal points based on the image gradient
and the smoothness of the contour. In [23], Xu et al. employed the deformable model
technique through minimization of the energy function defined by image intensity,
image gradient, and boundary smoothness. In [24], a level set is used to estimate the
disc followed by ellipse fitting to smooth the boundary. In [25], the authors proposed