
Page 219 - Computational Retinal Image Analysis
P. 219
3 Experimental results 215
250
200
Intensity 150 Original
GIF
Proposed
Vessel Optic Cup Boundary
100
50 100 150 200 250 300
Pixels
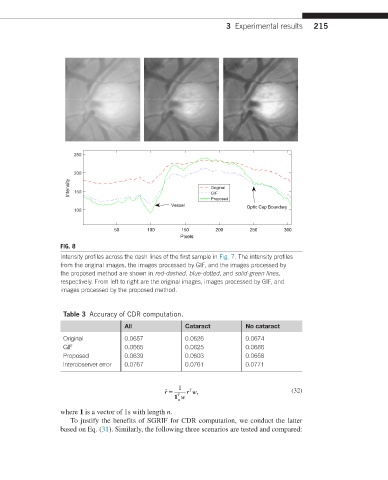
FIG. 8
Intensity profiles across the dash lines of the first sample in Fig. 7. The intensity profiles
from the original images, the images processed by GIF, and the images processed by
the proposed method are shown in red-dashed, blue-dotted, and solid-green lines,
respectively. From left to right are the original images, images processed by GIF, and
images processed by the proposed method.
Table 3 Accuracy of CDR computation.
All Cataract No cataract
Original 0.0657 0.0626 0.0674
GIF 0.0665 0.0625 0.0686
Proposed 0.0639 0.0603 0.0658
Interobserver error 0.0767 0.0761 0.0771
1
T
ˆ r = rw , (32)
1 T w w
where 1 is a vector of 1s with length n.
To justify the benefits of SGRIF for CDR computation, we conduct the latter
based on Eq. (31). Similarly, the following three scenarios are tested and compared: