
Page 220 - Computational Retinal Image Analysis
P. 220
216 CHAPTER 11 Structure-preserving guided retinal image filtering
(A) (B) (C)
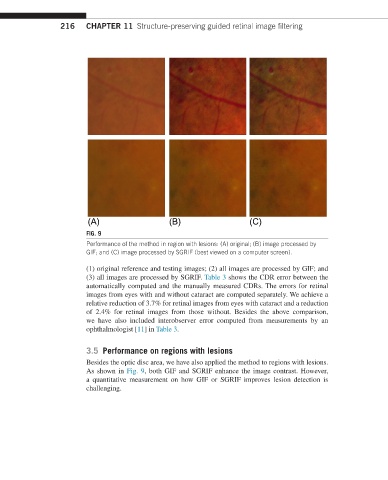
FIG. 9
Performance of the method in region with lesions: (A) original; (B) image processed by
GIF; and (C) image processed by SGRIF (best viewed on a computer screen).
(1) original reference and testing images; (2) all images are processed by GIF; and
(3) all images are processed by SGRIF. Table 3 shows the CDR error between the
automatically computed and the manually measured CDRs. The errors for retinal
images from eyes with and without cataract are computed separately. We achieve a
relative reduction of 3.7% for retinal images from eyes with cataract and a reduction
of 2.4% for retinal images from those without. Besides the above comparison,
we have also included interobserver error computed from measurements by an
ophthalmologist [11] in Table 3.
3.5 Performance on regions with lesions
Besides the optic disc area, we have also applied the method to regions with lesions.
As shown in Fig. 9, both GIF and SGRIF enhance the image contrast. However,
a quantitative measurement on how GIF or SGRIF improves lesion detection is
challenging.