
Page 287 - Computational Retinal Image Analysis
P. 287
3 Oct fluid detection 285
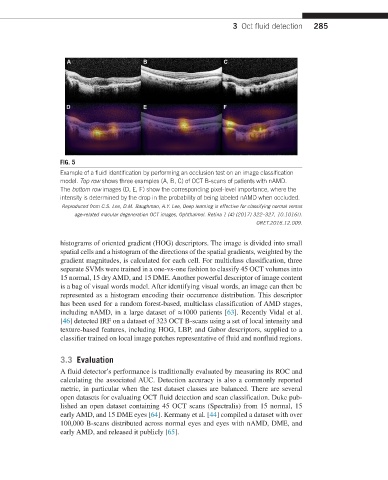
FIG. 5
Example of a fluid identification by performing an occlusion test on an image classification
model. Top row shows three examples (A, B, C) of OCT B-scans of patients with nAMD.
The bottom row images (D, E, F) show the corresponding pixel-level importance, where the
intensity is determined by the drop in the probability of being labeled nAMD when occluded.
Reproduced from C.S. Lee, D.M. Baughman, A.Y. Lee, Deep learning is effective for classifying normal versus
age-related macular degeneration OCT images, Ophthalmol. Retina 1 (4) (2017) 322–327, 10.1016/J.
ORET.2016.12.009.
histograms of oriented gradient (HOG) descriptors. The image is divided into small
spatial cells and a histogram of the directions of the spatial gradients, weighted by the
gradient magnitudes, is calculated for each cell. For multiclass classification, three
separate SVMs were trained in a one-vs-one fashion to classify 45 OCT volumes into
15 normal, 15 dry AMD, and 15 DME. Another powerful descriptor of image content
is a bag of visual words model. After identifying visual words, an image can then be
represented as a histogram encoding their occurrence distribution. This descriptor
has been used for a random forest-based, multiclass classification of AMD stages,
including nAMD, in a large dataset of ≈1000 patients [63]. Recently Vidal et al.
[46] detected IRF on a dataset of 323 OCT B-scans using a set of local intensity and
texture-based features, including HOG, LBP, and Gabor descriptors, supplied to a
classifier trained on local image patches representative of fluid and nonfluid regions.
3.3 Evaluation
A fluid detector’s performance is traditionally evaluated by measuring its ROC and
calculating the associated AUC. Detection accuracy is also a commonly reported
metric, in particular when the test dataset classes are balanced. There are several
open datasets for evaluating OCT fluid detection and scan classification. Duke pub-
lished an open dataset containing 45 OCT scans (Spectralis) from 15 normal, 15
early AMD, and 15 DME eyes [64]. Kermany et al. [44] compiled a dataset with over
100,000 B-scans distributed across normal eyes and eyes with nAMD, DME, and
early AMD, and released it publicly [65].