
Page 289 - Computational Retinal Image Analysis
P. 289
4 Clinical applications 287
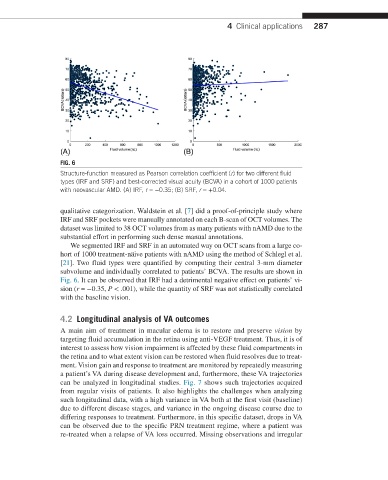
FIG. 6
Structure-function measured as Pearson correlation coefficient (r) for two different fluid
types (IRF and SRF) and best-corrected visual acuity (BCVA) in a cohort of 1000 patients
with neovascular AMD. (A) IRF, r = −0.35; (B) SRF, r = +0.04.
qualitative categorization. Waldstein et al. [7] did a proof-of-principle study where
IRF and SRF pockets were manually annotated on each B-scan of OCT volumes. The
dataset was limited to 38 OCT volumes from as many patients with nAMD due to the
substantial effort in performing such dense manual annotations.
We segmented IRF and SRF in an automated way on OCT scans from a large co-
hort of 1000 treatment-näive patients with nAMD using the method of Schlegl et al.
[21]. Two fluid types were quantified by computing their central 3-mm diameter
subvolume and individually correlated to patients’ BCVA. The results are shown in
Fig. 6. It can be observed that IRF had a detrimental negative effect on patients’ vi-
sion (r = −0.35, P < .001), while the quantity of SRF was not statistically correlated
with the baseline vision.
4.2 Longitudinal analysis of VA outcomes
A main aim of treatment in macular edema is to restore and preserve vision by
targeting fluid accumulation in the retina using anti-VEGF treatment. Thus, it is of
interest to assess how vision impairment is affected by these fluid compartments in
the retina and to what extent vision can be restored when fluid resolves due to treat-
ment. Vision gain and response to treatment are monitored by repeatedly measuring
a patient’s VA during disease development and, furthermore, these VA trajectories
can be analyzed in longitudinal studies. Fig. 7 shows such trajectories acquired
from regular visits of patients. It also highlights the challenges when analyzing
such longitudinal data, with a high variance in VA both at the first visit (baseline)
due to different disease stages, and variance in the ongoing disease course due to
differing responses to treatment. Furthermore, in this specific dataset, drops in VA
can be observed due to the specific PRN treatment regime, where a patient was
re-treated when a relapse of VA loss occurred. Missing observations and irregular