
Page 293 - Computational Retinal Image Analysis
P. 293
5 Discussion and conclusions 291
Visual acuity (letters) 90 Subject 1 Subject 2 Subject 3 Subject 4
70
50
30
0
0
100
300
300
200
100
200
Days 0 100 200 300 0 100 200 300
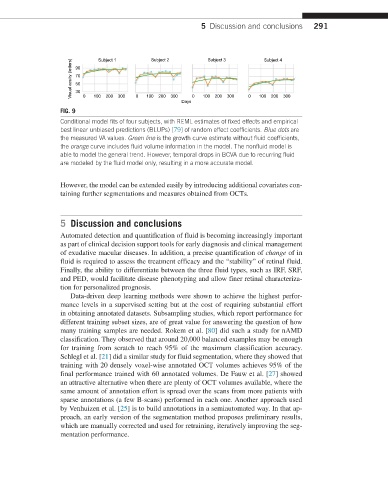
FIG. 9
Conditional model fits of four subjects, with REML estimates of fixed effects and empirical
best linear unbiased predictions (BLUPs) [79] of random effect coefficients. Blue dots are
the measured VA values. Green line is the growth curve estimate without fluid coefficients,
the orange curve includes fluid volume information in the model. The nonfluid model is
able to model the general trend. However, temporal drops in BCVA due to recurring fluid
are modeled by the fluid model only, resulting in a more accurate model.
However, the model can be extended easily by introducing additional covariates con-
taining further segmentations and measures obtained from OCTs.
5 Discussion and conclusions
Automated detection and quantification of fluid is becoming increasingly important
as part of clinical decision support tools for early diagnosis and clinical management
of exudative macular diseases. In addition, a precise quantification of change of in
fluid is required to assess the treatment efficacy and the “stability” of retinal fluid.
Finally, the ability to differentiate between the three fluid types, such as IRF, SRF,
and PED, would facilitate disease phenotyping and allow finer retinal characteriza-
tion for personalized prognosis.
Data-driven deep learning methods were shown to achieve the highest perfor-
mance levels in a supervised setting but at the cost of requiring substantial effort
in obtaining annotated datasets. Subsampling studies, which report performance for
different training subset sizes, are of great value for answering the question of how
many training samples are needed. Rokem et al. [80] did such a study for nAMD
classification. They observed that around 20,000 balanced examples may be enough
for training from scratch to reach 95% of the maximum classification accuracy.
Schlegl et al. [21] did a similar study for fluid segmentation, where they showed that
training with 20 densely voxel-wise annotated OCT volumes achieves 95% of the
final performance trained with 60 annotated volumes. De Fauw et al. [27] showed
an attractive alternative when there are plenty of OCT volumes available, where the
same amount of annotation effort is spread over the scans from more patients with
sparse annotations (a few B-scans) performed in each one. Another approach used
by Venhuizen et al. [25] is to build annotations in a semiautomated way. In that ap-
proach, an early version of the segmentation method proposes preliminary results,
which are manually corrected and used for retraining, iteratively improving the seg-
mentation performance.