
Page 292 - Computational Retinal Image Analysis
P. 292
290 CHAPTER 14 OCT fluid detection and quantification
interpretation of the fluid coefficients (β 3 to β 6 ), in the sense of how much VA is lost
in average by a unit increase of fluid in a retinal region. Note that the random-effect
weights, b, do not need to be estimated explicitly if one is interested in the popula-
tion mean effects, β, only. We obtain confidence intervals by parametric bootstrap-
ping [75] using resampling with replacement 500 times and compute the α/2 and
1 − α/2 quantile of the REML estimates of the resampled data. We use conditional
2
and marginal R as proposed by Nakagawa and Schielzeth [76] and Johnson [77] to
determine the quality of fit.
4.2.2 Experiments and results
Dataset
We performed inference on a dataset with 13 monthly follow-up OCT scans and VA
measures of patients with central RVO receiving anti-VEGF treatment using a PRN
scheme (n = 193, 2420 scans, 89 scans removed). IRF and SRF were segmented
automatically, and we computed the total fluid volumes v fov-irf , v fov-srf , v para-irf , and
v para-srf .
Regression model
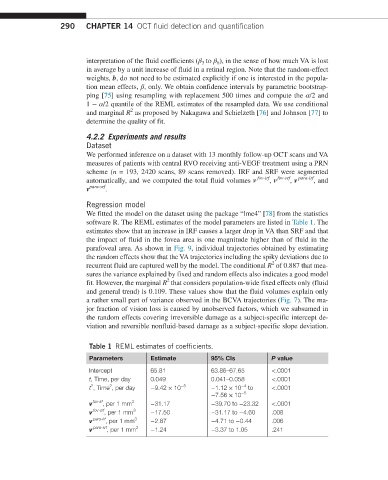
We fitted the model on the dataset using the package “lme4” [78] from the statistics
software R. The REML estimates of the model parameters are listed in Table 1. The
estimates show that an increase in IRF causes a larger drop in VA than SRF and that
the impact of fluid in the fovea area is one magnitude higher than of fluid in the
parafoveal area. As shown in Fig. 9, individual trajectories obtained by estimating
the random effects show that the VA trajectories including the spiky deviations due to
2
recurrent fluid are captured well by the model. The conditional R of 0.887 that mea-
sures the variance explained by fixed and random effects also indicates a good model
2
fit. However, the marginal R that considers population-wide fixed effects only (fluid
and general trend) is 0.109. These values show that the fluid volumes explain only
a rather small part of variance observed in the BCVA trajectories (Fig. 7). The ma-
jor fraction of vision loss is caused by unobserved factors, which we subsumed in
the random effects covering irreversible damage as a subject-specific intercept de-
viation and reversible nonfluid-based damage as a subject-specific slope deviation.
Table 1 REML estimates of coefficients.
Parameters Estimate 95% CIs P value
Intercept 65.81 63.86–67.65 <.0001
t, Time, per day 0.049 0.041–0.058 <.0001
2
2
−4
t , Time , per day −9.42 × 10 −5 −1.12 × 10 to <.0001
−7.56 × 10 −5
v fov-irf , per 1 mm 3 −31.17 −39.70 to −23.32 <.0001
v fov-srf , per 1 mm 3 −17.50 −31.17 to −4.60 .008
v para-irf , per 1 mm 3 −2.87 −4.71 to −0.44 .006
v para-srf , per 1 mm 3 −1.24 −3.37 to 1.05 .241