
Page 54 - Computational Retinal Image Analysis
P. 54
44 CHAPTER 3 The physics, instruments and modalities of retinal imaging
FIG. 17
Example of simultaneously displayed en-face images (A) SLO, (B) ICG and (C) OCT
showing age-related macular degeneration with occult choroidal neovascular membrane
[49]. Image size 12° × 12°.
implemented at the expense of complicated optical designs and can potentially trig-
ger some other issues such as galvo-scanner synchronization and dispersion compen-
sation problems that need to be addressed.
3.8.3 Camera based optical coherence tomography and exceptional
spatial resolutions
A typical schematic diagram of a CB-OCT system is depicted in Fig. 19. Here, in-
stead of a photo-detector, a spectrometer, is employed. Light from the sample and
from the reference mirror MR interferes at DC. The beam is then dispersed into
its wave-number components by a diffraction grating TG. Finally, the spectrum ob-
tained is digitized by a fast, linear camera (1 DC).
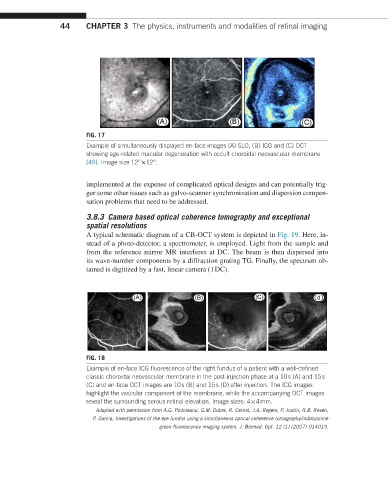
FIG. 18
Example of en-face ICG fluorescence of the right fundus of a patient with a well-defined
classic choroidal neovascular membrane in the post-injection phase at a 10 s (A) and 15 s
(C) and en-face OCT images are 10 s (B) and 15 s (D) after injection. The ICG images
highlight the vascular component of the membrane, while the accompanying OCT images
reveal the surrounding serous retinal elevation. Image sizes: 4 × 4 mm.
Adapted with permission from A.G. Podoleanu, G.M. Dobre, R. Cernat, J.A. Rogers, P. Justin, R.B. Rosen,
P. Garcia, Investigations of the eye fundus using a simultaneous optical coherence tomography/indocyanine
green fluorescence imaging system, J. Biomed. Opt. 12 (1) (2007) 014019.