
Page 115 -
P. 115
94 3 Image processing
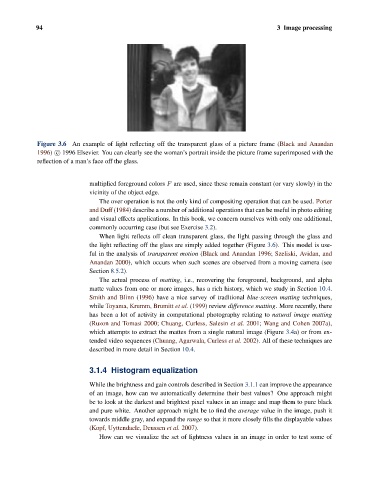
Figure 3.6 An example of light reflecting off the transparent glass of a picture frame (Black and Anandan
1996) c 1996 Elsevier. You can clearly see the woman’s portrait inside the picture frame superimposed with the
reflection of a man’s face off the glass.
multiplied foreground colors F are used, since these remain constant (or vary slowly) in the
vicinity of the object edge.
The over operation is not the only kind of compositing operation that can be used. Porter
and Duff (1984) describe a number of additional operations that can be useful in photo editing
and visual effects applications. In this book, we concern ourselves with only one additional,
commonly occurring case (but see Exercise 3.2).
When light reflects off clean transparent glass, the light passing through the glass and
the light reflecting off the glass are simply added together (Figure 3.6). This model is use-
ful in the analysis of transparent motion (Black and Anandan 1996; Szeliski, Avidan, and
Anandan 2000), which occurs when such scenes are observed from a moving camera (see
Section 8.5.2).
The actual process of matting, i.e., recovering the foreground, background, and alpha
matte values from one or more images, has a rich history, which we study in Section 10.4.
Smith and Blinn (1996) have a nice survey of traditional blue-screen matting techniques,
while Toyama, Krumm, Brumitt et al. (1999) review difference matting. More recently, there
has been a lot of activity in computational photography relating to natural image matting
(Ruzon and Tomasi 2000; Chuang, Curless, Salesin et al. 2001; Wang and Cohen 2007a),
which attempts to extract the mattes from a single natural image (Figure 3.4a) or from ex-
tended video sequences (Chuang, Agarwala, Curless et al. 2002). All of these techniques are
described in more detail in Section 10.4.
3.1.4 Histogram equalization
While the brightness and gain controls described in Section 3.1.1 can improve the appearance
of an image, how can we automatically determine their best values? One approach might
be to look at the darkest and brightest pixel values in an image and map them to pure black
and pure white. Another approach might be to find the average value in the image, push it
towards middle gray, and expand the range so that it more closely fills the displayable values
(Kopf, Uyttendaele, Deussen et al. 2007).
How can we visualize the set of lightness values in an image in order to test some of