
Page 124 - Control Theory in Biomedical Engineering
P. 124
110 Control theory in biomedical engineering
PVC P
1.5 1
1 0.8
0.5 0.6
0.4
Voltage(mV) –0.5 0 Voltage(mV) 0.2 0
–1
–1.5 –0.2
–2 –0.4
–2.5 –0.6
0 0.5 1 1.5 2 2.5 3 0 0.5 1 1.5 2 2.5 3
(A) Time(s) (B) Time(s)
LBBB RBBB
0.5 2
1.5
0 0
Voltage(mV) Voltage(mV) 0.5
–0.5 0
–0.5
–1 0 0.5 1 1.5 2 2.5 3 –1
(C) Time(s) (D) 0 0.5 1 Time(s) 2 2.5 3
1.5
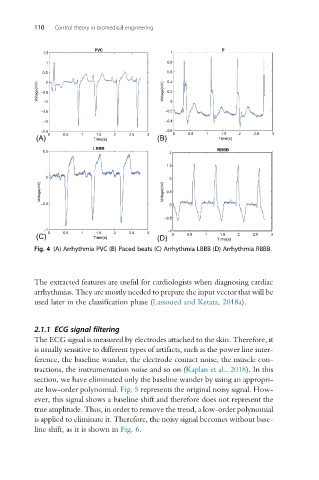
Fig. 4 (A) Arrhythmia PVC (B) Paced beats (C) Arrhythmia LBBB (D) Arrhythmia RBBB.
The extracted features are useful for cardiologists when diagnosing cardiac
arrhythmias. They are mostly needed to prepare the input vector that will be
used later in the classification phase (Lassoued and Ketata, 2018a).
2.1.1 ECG signal filtering
The ECG signal is measured by electrodes attached to the skin. Therefore, it
is usually sensitive to different types of artifacts, such as the power line inter-
ference, the baseline wander, the electrode contact noise, the muscle con-
tractions, the instrumentation noise and so on (Kaplan et al., 2018). In this
section, we have eliminated only the baseline wander by using an appropri-
ate low-order polynomial. Fig. 5 represents the original noisy signal. How-
ever, this signal shows a baseline shift and therefore does not represent the
true amplitude. Thus, in order to remove the trend, a low-order polynomial
is applied to eliminate it. Therefore, the noisy signal becomes without base-
line shift, as it is shown in Fig. 6.