
Page 126 - Control Theory in Biomedical Engineering
P. 126
112 Control theory in biomedical engineering
and their durations. It uses the functions developed in the WFDB toolbox
developed by Silva and Moody (2014) and it has proved its effectiveness in
several researches (Soria and Martı ´nez, 2009).
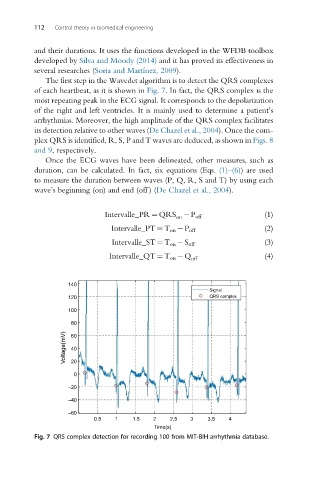
The first step in the Wavedet algorithm is to detect the QRS complexes
of each heartbeat, as it is shown in Fig. 7. In fact, the QRS complex is the
most repeating peak in the ECG signal. It corresponds to the depolarization
of the right and left ventricles. It is mainly used to determine a patient’s
arrhythmias. Moreover, the high amplitude of the QRS complex facilitates
its detection relative to other waves (De Chazel et al., 2004). Once the com-
plex QRS is identified, R, S, P and T waves are deduced, as shown in Figs. 8
and 9, respectively.
Once the ECG waves have been delineated, other measures, such as
duration, can be calculated. In fact, six equations (Eqs. (1)–(6)) are used
to measure the duration between waves (P, Q, R, S and T) by using each
wave’s beginning (on) and end (off ) (De Chazel et al., 2004).
Intervalle_PR ¼ QRS P off (1)
on
Intervalle_PT ¼ T on P off (2)
(3)
Intervalle_ST ¼ T on S off
Intervalle_QT ¼ T on Q off (4)
140
Signal
120 QRS complex
100
80
Voltage(mV) 60
40
20
0
–20
–40
–60
0.5 1 1.5 2 2.5 3 3.5 4
Time(s)
Fig. 7 QRS complex detection for recording 100 from MIT-BIH arrhythmia database.