
Page 123 - Control Theory in Biomedical Engineering
P. 123
Genetic fuzzy logic based system for arrhythmia classification 109
1.2
R
1
0.8
0.6
Voltage (mV) 0.2 0 T
0.4
–0.2 P
–0.4
–0.6 S
–0.8
0.2 0.3 0.4 0.5 0.6 0.7 0.8 0.9
Time(s)
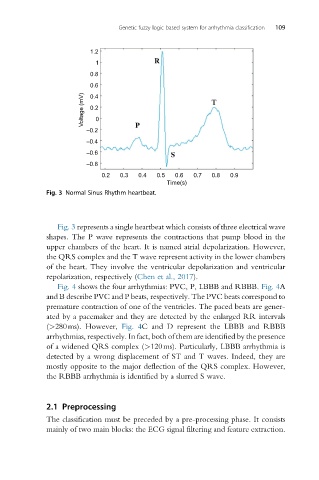
Fig. 3 Normal Sinus Rhythm heartbeat.
Fig. 3 represents a single heartbeat which consists of three electrical wave
shapes. The P wave represents the contractions that pump blood in the
upper chambers of the heart. It is named atrial depolarization. However,
the QRS complex and the T wave represent activity in the lower chambers
of the heart. They involve the ventricular depolarization and ventricular
repolarization, respectively (Chen et al., 2017).
Fig. 4 shows the four arrhythmias: PVC, P, LBBB and RBBB. Fig. 4A
and B describe PVC and P beats, respectively. The PVC beats correspond to
premature contraction of one of the ventricles. The paced beats are gener-
ated by a pacemaker and they are detected by the enlarged RR intervals
(>280ms). However, Fig. 4C and D represent the LBBB and RBBB
arrhythmias, respectively. In fact, both of them are identified by the presence
of a widened QRS complex (>120ms). Particularly, LBBB arrhythmia is
detected by a wrong displacement of ST and T waves. Indeed, they are
mostly opposite to the major deflection of the QRS complex. However,
the RBBB arrhythmia is identified by a slurred S wave.
2.1 Preprocessing
The classification must be preceded by a pre-processing phase. It consists
mainly of two main blocks: the ECG signal filtering and feature extraction.