
Page 127 - Control Theory in Biomedical Engineering
P. 127
Genetic fuzzy logic based system for arrhythmia classification 113
200 ECG signal
R wave
S wave
150
Voltage(mV) 100
50
0
–50
1.36 1.38 1.4 1.42 1.44 1.46 1.48
Time(s) 10 4
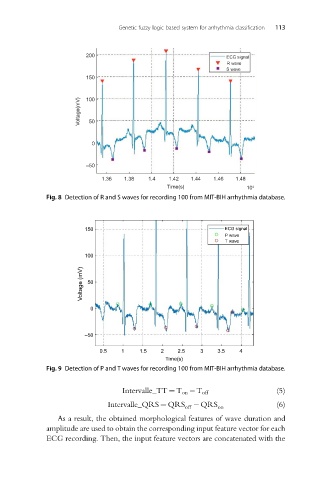
Fig. 8 Detection of R and S waves for recording 100 from MIT-BIH arrhythmia database.
150 ECG signal
P wave
T wave
100
Voltage (mV) 50
0
–50
0.5 1 1.5 2 2.5 3 3.5 4
Time(s)
Fig. 9 Detection of P and T waves for recording 100 from MIT-BIH arrhythmia database.
Intervalle_TT ¼ T on T off (5)
Intervalle_QRS ¼ QRS QRS (6)
off on
As a result, the obtained morphological features of wave duration and
amplitude are used to obtain the corresponding input feature vector for each
ECG recording. Then, the input feature vectors are concatenated with the