
Page 248 - Corrosion Engineering Principles and Practice
P. 248
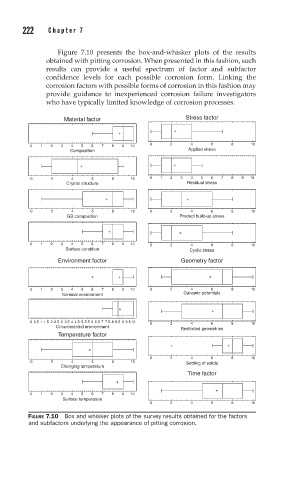
222    C h a p t e r   7                                                                                       C o r r o s i o n   F a i l u r e s ,   F a c t o r s ,   a n d   C e l l s    223


                         Figure  7.10  presents  the  box-and-whisker  plots  of  the  results
                      obtained with pitting corrosion. When presented in this fashion, such
                      results  can  provide  a  useful  spectrum  of  factor  and  subfactor
                      confidence  levels  for  each  possible  corrosion  form.  Linking  the
                      corrosion factors with possible forms of corrosion in this fashion may
                      provide  guidance  to  inexperienced  corrosion  failure  investigators
                      who have typically limited knowledge of corrosion processes.

                           Material factor                  Stress factor
                                          +              +
                                                  0     2     4    6     8    10
                  0  1  2  3  4  5  6  7  8  9  10
                             Composition                     Applied stress
                               +                         +
                  0    2     4    6     8    10   0  1  2  3  4  5  6  7  8  9  10
                            Crystal structure                Residual stress

                                      +                      +
                  0    2     4    6     8    10   0     2     4    6     8    10
                            GB composition                 Product build-up stress
                                       +                   +
                  0  1  2  3  4  5  6  7  8  9  10  0   2     4    6     8    10
                           Surface condition                 Cyclic stress
                         Environment factor                Geometry factor

                                          +                        +
                  0  1  2  3  4  5  6  7  8  9  10  0   2     4    6     8    10
                          Nominal environment               Galvanic potentials
                                          +                        +

                  0 0.5 1 1.5 2 2.5 3 3.5 4 4.5 5 5.5 6 6.5 7 7.5 8 8.5 9 9.5 10  0  2  4  6  8  10
                         Circumstantial environment
                                                           Restricted geometries
                         Temperature factor
                                                                        +
                                  +
                                                  0     2     4    6     8    10
                  0    2     4    6     8    10             Settling of solids
                          Changing temperature
                                                             Time factor
                                         +
                                                                    +
                  0  1  2  3  4  5  6  7  8  9  10
                           Surface temperature
                                                  0     2     4    6     8    10
                 FIGURE 7.10  Box and whisker plots of the survey results obtained for the factors
                 and subfactors underlying the appearance of pitting corrosion.