
Page 308 - Corrosion Engineering Principles and Practice
P. 308
278 C h a p t e r 8 C o r r o s i o n b y W a t e r 279
2
1.6
Corrosion rate (mm/y) 1.2
0.8
0.4
0
0 5 10 15 20 25 30 35
Sodium chloride (%)
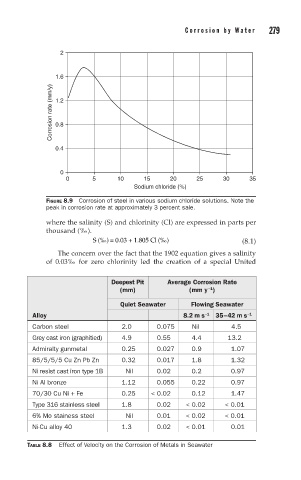
FIGURE 8.9 Corrosion of steel in various sodium chloride solutions. Note the
peak in corrosion rate at approximately 3 percent sale.
where the salinity (S) and chlorinity (Cl) are expressed in parts per
thousand (‰).
S (‰) = 0.03 + 1.805 Cl (‰) (8.1)
The concern over the fact that the 1902 equation gives a salinity
of 0.03‰ for zero chlorinity led the creation of a special United
Deepest Pit Average Corrosion Rate
(mm) (mm y )
-1
Quiet Seawater Flowing Seawater
Alloy 8.2 m s -1 35 – 42 m s -1
Carbon steel 2.0 0.075 Nil 4.5
Grey cast iron (graphitied) 4.9 0.55 4.4 13.2
Admiralty gunmetal 0.25 0.027 0.9 1.07
85/5/5/5 Cu Zn Pb Zn 0.32 0.017 1.8 1.32
Ni resist cast iron type 1B Nil 0.02 0.2 0.97
Ni Al bronze 1.12 0.055 0.22 0.97
70/30 Cu Ni + Fe 0.25 < 0.02 0.12 1.47
Type 316 stainless steel 1.8 0.02 < 0.02 < 0.01
6% Mo stainess steel Nil 0.01 < 0.02 < 0.01
Ni-Cu alloy 40 1.3 0.02 < 0.01 0.01
TABLE 8.8 Effect of Velocity on the Corrosion of Metals in Seawater