
Page 345 - DSP Integrated Circuits
P. 345
330 Chapter 7 DSP System Design
7.8.1 Clique Partitioning
The resource allocation problem can be solved by using different types of graphs
to determine whether two processes of the same type may, or may not, share a
resource. For example, two multiplications (processes) may be executed on a sin-
gle multiplier (resource). The connectivity graph (which is also called a compati-
bility graph) is obtained by connecting two vertices with an edge if the lifetimes
of the corresponding processes do not overlap. This implies that the processes
may share a resource. A separate connectivity graph may be used for each type of
resource if there are different types of processes that require different types of
resources.
In order to determine which processes can share resources, we partition the
connectivity graph into a number of cliques where a clique is denned as a fully
connected subgraph that has an edge between all pairs of vertices. Thus, the pro-
cesses corresponding to the vertices in a clique may share the same resource.
Now, we choose the cliques so that they completely cover the connectivity
graph—i.e., so that every vertex belongs to one, and only one, clique. Hence, each
clique will correspond to a set of processes that may share a resource and the
number of cliques used to cover the connectivity graph determines the number of
resources.
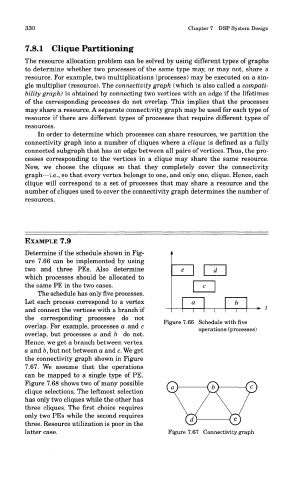
EXAMPLE 7.9
Determine if the schedule shown in Fig-
ure 7.66 can be implemented by using
two and three PEs. Also determine
which processes should be allocated to
the same PE in the two cases.
The schedule has only five processes.
Let each process correspond to a vertex
and connect the vertices with a branch if
the corresponding processes do not Figure 7.66 Schedule with five
overlap. For example, processes a and c
operations (processes)
overlap, but processes a and b do not.
Hence, we get a branch between vertex
a and b, but not between a and c. We get
the connectivity graph shown in Figure
7.67. We assume that the operations
can be mapped to a single type of PE.
Figure 7.68 shows two of many possible
clique selections. The leftmost selection
has only two cliques while the other has
three cliques. The first choice requires
only two PEs while the second requires
three. Resource utilization is poor in the
latter case. Figure 7.67 Connectivity graph