
Page 361 - DSP Integrated Circuits
P. 361
346 Chapter 7 DSP System Design
Data Index
ROWO IB ] J B I 1 B [
B
B
Rowi V1 P' J B L ^J L \ i
B
B
B
2
ROW /\j [ '\i rj r /k A
/
Row 3 J B LJ B L'J B L
Stage 1 2 3
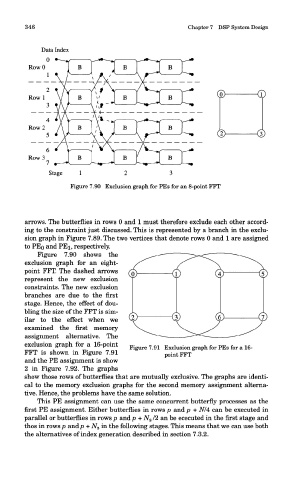
Figure 7.90 Exclusion graph for PEs for an 8-point FFT
arrows. The butterflies in rows 0 and 1 must therefore exclude each other accord-
ing to the constraint just discussed. This is represented by a branch in the exclu-
sion graph in Figure 7.89. The two vertices that denote rows 0 and 1 are assigned
to F&Q and r&i, respectively.
Figure 7.90 shows the
exclusion graph for an eight-
point FFT. The dashed arrows
represent the new exclusion
constraints. The new exclusion
branches are due to the first
stage. Hence, the effect of dou-
bling the size of the FFT is sim-
ilar to the effect when we
examined the first memory
assignment alternative. The
exclusion graph for a 16-point
Figure 7.91 Exclusion graph for PEs for a 16-
FFT is shown in Figure 7.91 point FFT
and the PE assignment is show
2 in Figure 7.92. The graphs
show those rows of butterflies that are mutually exclusive. The graphs are identi-
cal to the memory exclusion graphs for the second memory assignment alterna-
tive. Hence, the problems have the same solution.
This PE assignment can use the same concurrent butterfly processes as the
first PE assignment. Either butterflies in rows p and p + N/4 can be executed in
parallel or butterflies in rows p and p + N s /2 an be ececuted in the first stage and
thos in rows p andp + N s in the following stages. This means that we can use both
the alternatives of index generation described in section 7.3.2.