Page 103 -
P. 103

HAN 09-ch02-039-082-9780123814791


          66    Chapter 2 Getting to Know Your Data          2011/6/1  3:15  Page 66  #28


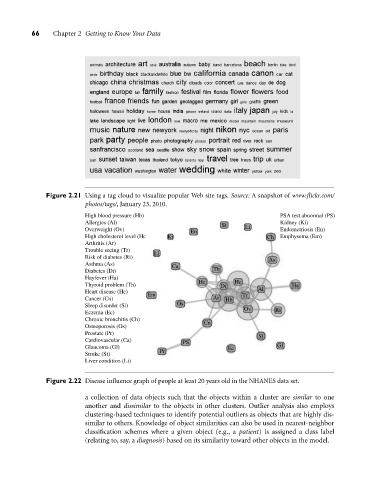
              Figure 2.21 Using a tag cloud to visualize popular Web site tags. Source: A snapshot of www.flickr.com/
                         photos/tags/, January 23, 2010.
                         High blood pressure (Hb)                              PSA test abnormal (PS)
                         Allergies (Al)                        St              Kidney (Ki)
                         Overweight (Ov)              En             Li        Endometriosis (En)
                         High cholesterol level (Hc)  Ki                   Ch  Emphysema (Em)
                         Arthritis (Ar)
                         Trouble seeing (Tr)
                                            Li
                         Risk of diabetes (Ri)                              As
                         Asthma (As)             Ca
                         Diabetes (Di)                      Th
                         Hayfever (Ha)
                         Thyroid problem (Th)           He    Di  Hc              Ha
                         Heart disease (He)  Em                     Tr   Al
                         Cancer (Cn)                        Ar  Hb
                         Sleep disorder (Sl)      Os
                                                                     Ov       Ri
                         Eczema (Ec)
                         Chronic bronchitis (Ch)
                                                          Cn
                         Osteoporosis (Os)
                         Prostate (Pr)
                                                                         Sl
                         Cardiovascular (Ca)
                                                    PS
                         Glaucoma (Gl)                          Ec            Gl
                         Stroke (St)         Pr
                         Liver condition (Li)
              Figure 2.22 Disease influence graph of people at least 20 years old in the NHANES data set.
                         a collection of data objects such that the objects within a cluster are similar to one
                         another and dissimilar to the objects in other clusters. Outlier analysis also employs
                         clustering-based techniques to identify potential outliers as objects that are highly dis-
                         similar to others. Knowledge of object similarities can also be used in nearest-neighbor
                         classification schemes where a given object (e.g., a patient) is assigned a class label
                         (relating to, say, a diagnosis) based on its similarity toward other objects in the model.
   98   99   100   101   102   103   104   105   106   107   108