
Page 99 -
P. 99
HAN 09-ch02-039-082-9780123814791
62 Chapter 2 Getting to Know Your Data 2011/6/1 3:15 Page 62 #24
y
10
5
0 x
–5
–10
1 2 3 4 5 6 7 8 9 10
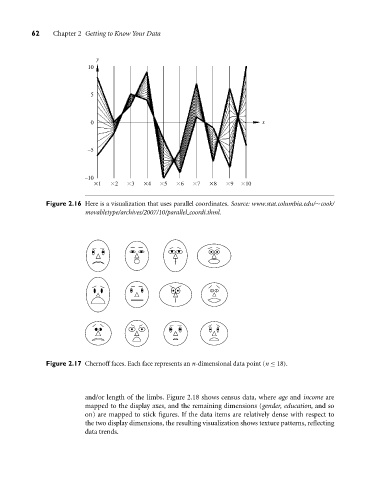
Figure 2.16 Here is a visualization that uses parallel coordinates. Source: www.stat.columbia.edu/∼cook/
movabletype/archives/2007/10/parallel coordi.thml.
Figure 2.17 Chernoff faces. Each face represents an n-dimensional data point (n ≤ 18).
and/or length of the limbs. Figure 2.18 shows census data, where age and income are
mapped to the display axes, and the remaining dimensions (gender, education, and so
on) are mapped to stick figures. If the data items are relatively dense with respect to
the two display dimensions, the resulting visualization shows texture patterns, reflecting
data trends.