
Page 97 -
P. 97
HAN 09-ch02-039-082-9780123814791
60 Chapter 2 Getting to Know Your Data 2011/6/1 3:15 Page 60 #22
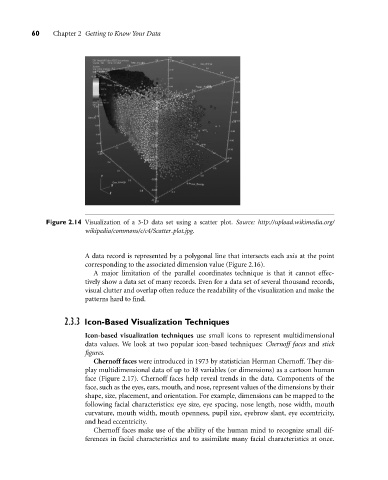
Figure 2.14 Visualization of a 3-D data set using a scatter plot. Source: http://upload.wikimedia.org/
wikipedia/commons/c/c4/Scatter plot.jpg.
A data record is represented by a polygonal line that intersects each axis at the point
corresponding to the associated dimension value (Figure 2.16).
A major limitation of the parallel coordinates technique is that it cannot effec-
tively show a data set of many records. Even for a data set of several thousand records,
visual clutter and overlap often reduce the readability of the visualization and make the
patterns hard to find.
2.3.3 Icon-Based Visualization Techniques
Icon-based visualization techniques use small icons to represent multidimensional
data values. We look at two popular icon-based techniques: Chernoff faces and stick
figures.
Chernoff faces were introduced in 1973 by statistician Herman Chernoff. They dis-
play multidimensional data of up to 18 variables (or dimensions) as a cartoon human
face (Figure 2.17). Chernoff faces help reveal trends in the data. Components of the
face, such as the eyes, ears, mouth, and nose, represent values of the dimensions by their
shape, size, placement, and orientation. For example, dimensions can be mapped to the
following facial characteristics: eye size, eye spacing, nose length, nose width, mouth
curvature, mouth width, mouth openness, pupil size, eyebrow slant, eye eccentricity,
and head eccentricity.
Chernoff faces make use of the ability of the human mind to recognize small dif-
ferences in facial characteristics and to assimilate many facial characteristics at once.