
Page 95 -
P. 95
HAN 09-ch02-039-082-9780123814791
58 Chapter 2 Getting to Know Your Data 2011/6/1 3:15 Page 58 #20
(a) Hilbert curve (b) Gray code (c) Z-curve
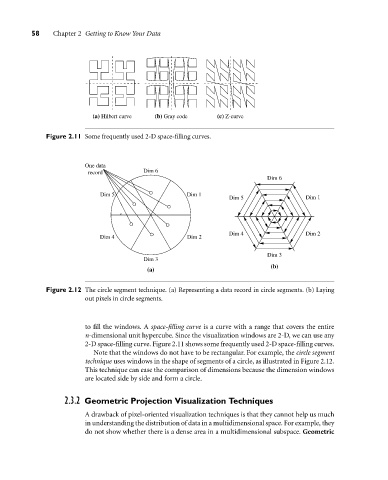
Figure 2.11 Some frequently used 2-D space-filling curves.
One data
record Dim 6
Dim 6
Dim 5 Dim 1
Dim 5 Dim 1
Dim 4 Dim 2
Dim 4 Dim 2
Dim 3
Dim 3
(b)
(a)
Figure 2.12 The circle segment technique. (a) Representing a data record in circle segments. (b) Laying
out pixels in circle segments.
to fill the windows. A space-filling curve is a curve with a range that covers the entire
n-dimensional unit hypercube. Since the visualization windows are 2-D, we can use any
2-D space-filling curve. Figure 2.11 shows some frequently used 2-D space-filling curves.
Note that the windows do not have to be rectangular. For example, the circle segment
technique uses windows in the shape of segments of a circle, as illustrated in Figure 2.12.
This technique can ease the comparison of dimensions because the dimension windows
are located side by side and form a circle.
2.3.2 Geometric Projection Visualization Techniques
A drawback of pixel-oriented visualization techniques is that they cannot help us much
in understanding the distribution of data in a multidimensional space. For example, they
do not show whether there is a dense area in a multidimensional subspace. Geometric