
Page 100 -
P. 100
#25
2011/6/1
3:15
Page 63
HAN 09-ch02-039-082-9780123814791
2.3 Data Visualization 63
age
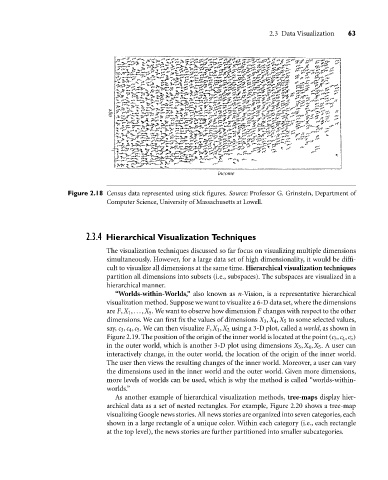
income
Figure 2.18 Census data represented using stick figures. Source: Professor G. Grinstein, Department of
Computer Science, University of Massachusetts at Lowell.
2.3.4 Hierarchical Visualization Techniques
The visualization techniques discussed so far focus on visualizing multiple dimensions
simultaneously. However, for a large data set of high dimensionality, it would be diffi-
cult to visualize all dimensions at the same time. Hierarchical visualization techniques
partition all dimensions into subsets (i.e., subspaces). The subspaces are visualized in a
hierarchical manner.
“Worlds-within-Worlds,” also known as n-Vision, is a representative hierarchical
visualization method. Suppose we want to visualize a 6-D data set, where the dimensions
are F,X 1 ,...,X 5 . We want to observe how dimension F changes with respect to the other
dimensions. We can first fix the values of dimensions X 3 ,X 4 ,X 5 to some selected values,
say, c 3 ,c 4 ,c 5 . We can then visualize F,X 1 ,X 2 using a 3-D plot, called a world, as shown in
Figure 2.19. The position of the origin of the inner world is located at the point (c 3 ,c 4 ,c 5 )
in the outer world, which is another 3-D plot using dimensions X 3 ,X 4 ,X 5 . A user can
interactively change, in the outer world, the location of the origin of the inner world.
The user then views the resulting changes of the inner world. Moreover, a user can vary
the dimensions used in the inner world and the outer world. Given more dimensions,
more levels of worlds can be used, which is why the method is called “worlds-within-
worlds.”
As another example of hierarchical visualization methods, tree-maps display hier-
archical data as a set of nested rectangles. For example, Figure 2.20 shows a tree-map
visualizing Google news stories. All news stories are organized into seven categories, each
shown in a large rectangle of a unique color. Within each category (i.e., each rectangle
at the top level), the news stories are further partitioned into smaller subcategories.