
Page 102 -
P. 102
3:15
#27
2011/6/1
Page 65
HAN 09-ch02-039-082-9780123814791
2.4 Measuring Data Similarity and Dissimilarity 65
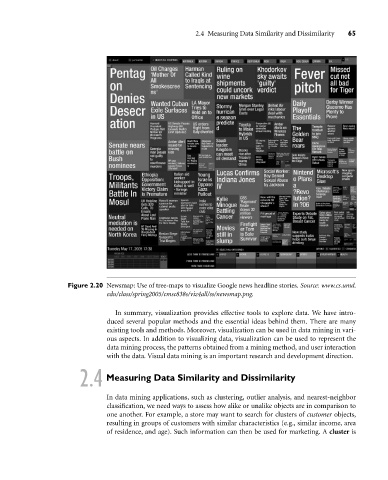
Figure 2.20 Newsmap: Use of tree-maps to visualize Google news headline stories. Source: www.cs.umd.
edu/class/spring2005/cmsc838s/viz4all/ss/newsmap.png.
In summary, visualization provides effective tools to explore data. We have intro-
duced several popular methods and the essential ideas behind them. There are many
existing tools and methods. Moreover, visualization can be used in data mining in vari-
ous aspects. In addition to visualizing data, visualization can be used to represent the
data mining process, the patterns obtained from a mining method, and user interaction
with the data. Visual data mining is an important research and development direction.
2.4 Measuring Data Similarity and Dissimilarity
In data mining applications, such as clustering, outlier analysis, and nearest-neighbor
classification, we need ways to assess how alike or unalike objects are in comparison to
one another. For example, a store may want to search for clusters of customer objects,
resulting in groups of customers with similar characteristics (e.g., similar income, area
of residence, and age). Such information can then be used for marketing. A cluster is