
Page 92 -
P. 92
HAN 09-ch02-039-082-9780123814791
3:15
Page 55
2011/6/1
#17
2.2 Basic Statistical Descriptions of Data 55
6000
5000
Count of items sold 3000
4000
2000
1000
0
40–59 60–79 80–99 100–119 120–139
Unit price ($)
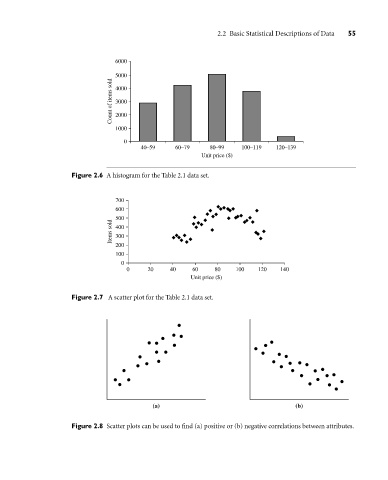
Figure 2.6 A histogram for the Table 2.1 data set.
700
600
Items sold 500
400
300
200
100
0
0 20 40 60 80 100 120 140
Unit price ($)
Figure 2.7 A scatter plot for the Table 2.1 data set.
(a) (b)
Figure 2.8 Scatter plots can be used to find (a) positive or (b) negative correlations between attributes.