
Page 167 - Decision Making Applications in Modern Power Systems
P. 167
Modeling and simulation Chapter | 5 131
Irradiation curve: The irradiation curve is in per unit values, based on a
specified value.
Daily panel temperature: The temperature curve is measured on the panel
in Celsius over the simulated period.
Variation of panel power with temperature: Temperature influences the
performance of PV systems; thus a panel power reduction curve is pro-
vided as a function of its temperature.
Inverter efficiency: The output power of the model considers the effi-
ciency of the inverter. This gives an efficiency curve of the inverter as a
function of the input power in per unit values.
Some parameters such as the connection topology of the PV system to
the grid, the PV PF, and the output voltage should be provided. Then, the
power supplied by the PV to the system is given by (5.4), where Eff (P (t) )
corresponds to the efficiency of the inverter for a given output power of the
panel, and P (t) is the power of the panel provided by (5.5).
PðtÞ out 5 P tðÞ 3 EffðP ðtÞ Þ ð5:4Þ
P tðÞ 5 P mpp 3 irrad ðtÞ 3 irrad ðbaseÞ 3 P mpp ðTtðÞÞ ð5:5Þ
where P mpp corresponds to the power at the point of maximum power,
irrad ðtÞ is the irradiance in p.u. at time t, irrad ðbaseÞ is the base irradiance in
kW, and P mpp TtðÞð Þ is the power correction factor with temperature.
The reactive power is defined separately and can be defined with a fixed
kVAr or a fixed PF.
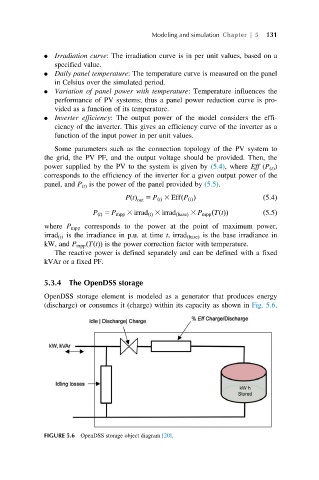
5.3.4 The OpenDSS storage
OpenDSS storage element is modeled as a generator that produces energy
(discharge) or consumes it (charge) within its capacity as shown in Fig. 5.6.
FIGURE 5.6 OpenDSS storage object diagram [20].