
Page 172 - Decision Making Applications in Modern Power Systems
P. 172
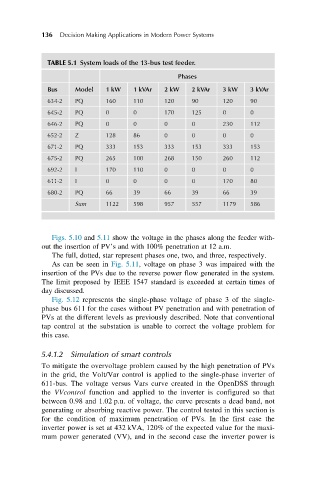
136  Decision Making Applications in Modern Power Systems


              TABLE 5.1 System loads of the 13-bus test feeder.
                                                 Phases

              Bus    Model    1 kW   1 kVAr  2 kW    2 kVAr  3 kW    3 kVAr
              634-2  PQ       160    110     120     90      120     90
              645-2  PQ       0      0       170     125     0       0
              646-2  PQ       0      0       0       0       230     112
              652-2  Z        128    86      0       0       0       0
              671-2  PQ       333    153     333     153     333     153
              675-2  PQ       265    100     268     150     260     112
              692-2  I        170    110     0       0       0       0
              611-2  I        0      0       0       0       170     80
              680-2  PQ       66     39      66      39      66      39
                     Sum      1122   598     957     557     1179    586


               Figs. 5.10 and 5.11 show the voltage in the phases along the feeder with-
            out the insertion of PV’s and with 100% penetration at 12 a.m.
               The full, dotted, star represent phases one, two, and three, respectively.
               As can be seen in Fig. 5.11, voltage on phase 3 was impaired with the
            insertion of the PVs due to the reverse power flow generated in the system.
            The limit proposed by IEEE 1547 standard is exceeded at certain times of
            day discussed.
               Fig. 5.12 represents the single-phase voltage of phase 3 of the single-
            phase bus 611 for the cases without PV penetration and with penetration of
            PVs at the different levels as previously described. Note that conventional
            tap control at the substation is unable to correct the voltage problem for
            this case.

            5.4.1.2 Simulation of smart controls
            To mitigate the overvoltage problem caused by the high penetration of PVs
            in the grid, the Volt/Var control is applied to the single-phase inverter of
            611-bus. The voltage versus Vars curve created in the OpenDSS through
            the VVcontrol function and applied to the inverter is configured so that
            between 0.98 and 1.02 p.u. of voltage, the curve presents a dead band, not
            generating or absorbing reactive power. The control tested in this section is
            for the condition of maximum penetration of PVs. In the first case the
            inverter power is set at 432 kVA, 120% of the expected value for the maxi-
            mum power generated (VV), and in the second case the inverter power is