
Page 171 - Decision Making Applications in Modern Power Systems
P. 171
Modeling and simulation Chapter | 5 135
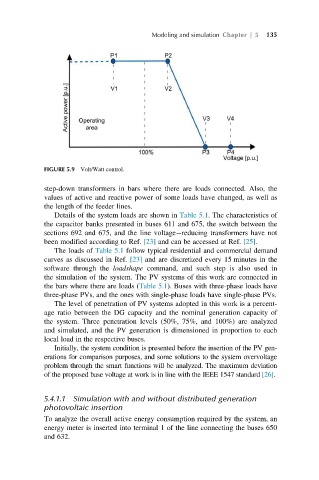
FIGURE 5.9 Volt/Watt control.
step-down transformers in bars where there are loads connected. Also, the
values of active and reactive power of some loads have changed, as well as
the length of the feeder lines.
Details of the system loads are shown in Table 5.1. The characteristics of
the capacitor banks presented in buses 611 and 675, the switch between the
sections 692 and 675, and the line voltage reducing transformers have not
been modified according to Ref. [23] and can be accessed at Ref. [25].
The loads of Table 5.1 follow typical residential and commercial demand
curves as discussed in Ref. [23] and are discretized every 15 minutes in the
software through the loadshape command, and such step is also used in
the simulation of the system. The PV systems of this work are connected in
the bars where there are loads (Table 5.1). Buses with three-phase loads have
three-phase PVs, and the ones with single-phase loads have single-phase PVs.
The level of penetration of PV systems adopted in this work is a percent-
age ratio between the DG capacity and the nominal generation capacity of
the system. Three penetration levels (50%, 75%, and 100%) are analyzed
and simulated, and the PV generation is dimensioned in proportion to each
local load in the respective buses.
Initially, the system condition is presented before the insertion of the PV gen-
erations for comparison purposes, and some solutions to the system overvoltage
problem through the smart functions will be analyzed. The maximum deviation
of the proposed base voltage at work is in line with the IEEE 1547 standard [26].
5.4.1.1 Simulation with and without distributed generation
photovoltaic insertion
To analyze the overall active energy consumption required by the system, an
energy meter is inserted into terminal 1 of the line connecting the buses 650
and 632.