
Page 269 - Decision Making Applications in Modern Power Systems
P. 269
232 Decision Making Applications in Modern Power Systems
95th percentile Bus voltage
of bus voltage uncertainty
Upper bound of
voltage uncertainty Index limit
Performance index (bus voltage)
Lower bound of
voltage uncertainty
HC U HC 95 HC L Amount of DG
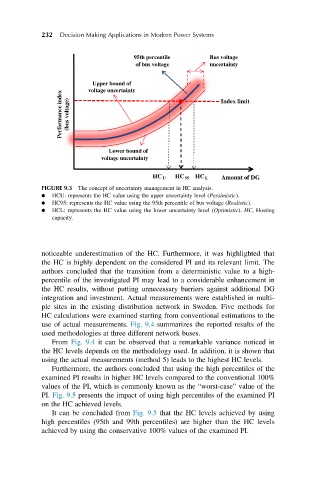
FIGURE 9.3 The concept of uncertainty management in HC analysis.
HCU: represents the HC value using the upper uncertainty level (Pessimistic).
HC95: represents the HC value using the 95th percentile of bus voltage (Realistic).
HCL: represents the HC value using the lower uncertainty level (Optimistic). HC, Hosting
capacity.
noticeable underestimation of the HC. Furthermore, it was highlighted that
the HC is highly dependent on the considered PI and its relevant limit. The
authors concluded that the transition from a deterministic value to a high-
percentile of the investigated PI may lead to a considerable enhancement in
the HC results, without putting unnecessary barriers against additional DG
integration and investment. Actual measurements were established in multi-
ple sites in the existing distribution network in Sweden. Five methods for
HC calculations were examined starting from conventional estimations to the
use of actual measurements. Fig. 9.4 summarizes the reported results of the
used methodologies at three different network buses.
From Fig. 9.4 it can be observed that a remarkable variance noticed in
the HC levels depends on the methodology used. In addition, it is shown that
using the actual measurements (method 5) leads to the highest HC levels.
Furthermore, the authors concluded that using the high percentiles of the
examined PI results in higher HC levels compared to the conventional 100%
values of the PI, which is commonly known as the “worst-case” value of the
PI. Fig. 9.5 presents the impact of using high percentiles of the examined PI
on the HC achieved levels.
It can be concluded from Fig. 9.5 that the HC levels achieved by using
high percentiles (95th and 99th percentiles) are higher than the HC levels
achieved by using the conservative 100% values of the examined PI.