
Page 351 - Decision Making Applications in Modern Power Systems
P. 351
Heuristic methods for the evaluation of environmental impacts Chapter | 12 313
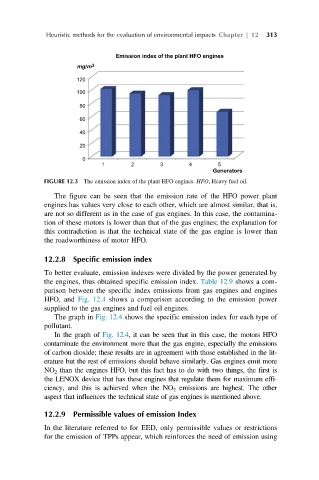
Emission index of the plant HFO engines
mg/m 3
120
100
80
60
40
20
0
1 2 3 4 5
Generators
FIGURE 12.3 The emission index of the plant HFO engines. HFO, Heavy fuel oil.
The figure can be seen that the emission rate of the HFO power plant
engines has values very close to each other, which are almost similar, that is,
are not so different as in the case of gas engines. In this case, the contamina-
tion of these motors is lower than that of the gas engines; the explanation for
this contradiction is that the technical state of the gas engine is lower than
the roadworthiness of motor HFO.
12.2.8 Specific emission index
To better evaluate, emission indexes were divided by the power generated by
the engines, thus obtained specific emission index. Table 12.9 shows a com-
parison between the specific index emissions from gas engines and engines
HFO, and Fig. 12.4 shows a comparison according to the emission power
supplied to the gas engines and fuel oil engines.
The graph in Fig. 12.4 shows the specific emission index for each type of
pollutant.
In the graph of Fig. 12.4, it can be seen that in this case, the motors HFO
contaminate the environment more than the gas engine, especially the emissions
of carbon dioxide; these results are in agreement with those established in the lit-
erature but the rest of emissions should behave similarly. Gas engines emit more
NO 2 than the engines HFO, but this fact has to do with two things, the first is
the LENOX device that has these engines that regulate them for maximum effi-
ciency, and this is achieved when the NO 2 emissions are highest. The other
aspect that influences the technical state of gas engines is mentioned above.
12.2.9 Permissible values of emission Index
In the literature referred to for EED, only permissible values or restrictions
for the emission of TPPs appear, which reinforces the need of emission using