
Page 350 - Decision Making Applications in Modern Power Systems
P. 350
312 Decision Making Applications in Modern Power Systems
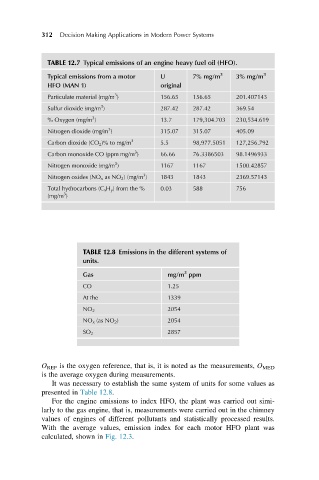
TABLE 12.7 Typical emissions of an engine heavy fuel oil (HFO).
Typical emissions from a motor U 7% mg/m 3 3% mg/m 3
HFO (MAN 1) original
3
Particulate material (mg/m ) 156.65 156.65 201.407143
3
Sulfur dioxide (mg/m ) 287.42 287.42 369.54
3
% Oxygen (mg/m ) 13.7 179,304.703 230,534.619
3
Nitrogen dioxide (mg/m ) 315.07 315.07 405.09
Carbon dioxide (CO 2 )% to mg/m 3 5.5 98,977.5051 127,256.792
3
Carbon monoxide CO (ppm mg/m ) 66.66 76.3386503 98.1496933
3
Nitrogen monoxide (mg/m ) 1167 1167 1500.42857
3
Nitrogen oxides (NO x as NO 2 ) (mg/m ) 1843 1843 2369.57143
Total hydrocarbons (C x H y ) from the % 0.03 588 756
3
(mg/m )
TABLE 12.8 Emissions in the different systems of
units.
3
Gas mg/m ppm
CO 1.25
At the 1339
NO 2 2054
NO x (as NO 2 ) 2054
SO 2 2857
O REF is the oxygen reference, that is, it is noted as the measurements, O MED
is the average oxygen during measurements.
It was necessary to establish the same system of units for some values as
presented in Table 12.8.
For the engine emissions to index HFO, the plant was carried out simi-
larly to the gas engine, that is, measurements were carried out in the chimney
values of engines of different pollutants and statistically processed results.
With the average values, emission index for each motor HFO plant was
calculated, shown in Fig. 12.3.