
Page 467 - Decision Making Applications in Modern Power Systems
P. 467
426 Decision Making Applications in Modern Power Systems
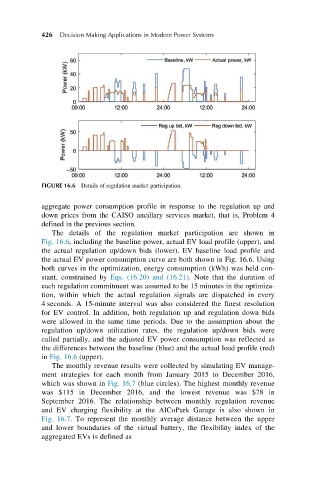
FIGURE 16.6 Details of regulation market participation.
aggregate power consumption profile in response to the regulation up and
down prices from the CAISO ancillary services market, that is, Problem 4
defined in the previous section.
The details of the regulation market participation are shown in
Fig. 16.6, including the baseline power, actual EV load profile (upper), and
the actual regulation up/down bids (lower). EV baseline load profile and
the actual EV power consumption curve are both shown in Fig. 16.6. Using
both curves in the optimization, energy consumption (kWh) was held con-
stant, constrained by Eqs. (16.20) and (16.21). Note that the duration of
each regulation commitment was assumed to be 15 minutes in the optimiza-
tion, within which the actual regulation signals are dispatched in every
4 seconds. A 15-minute interval was also considered the finest resolution
for EV control. In addition, both regulation up and regulation down bids
were allowed in the same time periods. Due to the assumption about the
regulation up/down utilization rates, the regulation up/down bids were
called partially, and the adjusted EV power consumption was reflected as
the differences between the baseline (blue) and the actual load profile (red)
in Fig. 16.6 (upper).
The monthly revenue results were collected by simulating EV manage-
ment strategies for each month from January 2015 to December 2016,
which was shown in Fig. 16.7 (blue circles). The highest monthly revenue
was $115 in December 2016, and the lowest revenue was $78 in
September 2016. The relationship between monthly regulation revenue
and EV charging flexibility at the AlCoPark Garage is also shown in
Fig. 16.7. To represent the monthly average distance between the upper
and lower boundaries of the virtual battery, the flexibility index of the
aggregated EVs is defined as