
Page 468 - Decision Making Applications in Modern Power Systems
P. 468
Multistage and decentralized operations of Chapter | 16 427
150
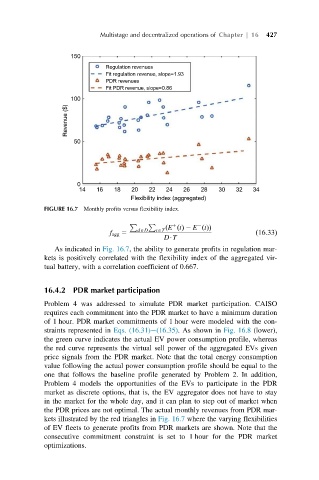
Regulation revenues
Fit regulation revenue, slope=1.93
PDR revenues
Fit PDR revenue, slope=0.86
100
Revenue ($)
50
0
14 16 18 20 22 24 26 28 30 32 34
Flexibility index (aggregated)
FIGURE 16.7 Monthly profits versus flexibility index.
1 2
P P
ðE tðÞ 2 E tðÞÞ
f agg 5 dAD tAT ð16:33Þ
DUT
As indicated in Fig. 16.7, the ability to generate profits in regulation mar-
kets is positively correlated with the flexibility index of the aggregated vir-
tual battery, with a correlation coefficient of 0.667.
16.4.2 PDR market participation
Problem 4 was addressed to simulate PDR market participation. CAISO
requires each commitment into the PDR market to have a minimum duration
of 1 hour. PDR market commitments of 1 hour were modeled with the con-
straints represented in Eqs. (16.31) (16.35). As shown in Fig. 16.8 (lower),
the green curve indicates the actual EV power consumption profile, whereas
the red curve represents the virtual sell power of the aggregated EVs given
price signals from the PDR market. Note that the total energy consumption
value following the actual power consumption profile should be equal to the
one that follows the baseline profile generated by Problem 2. In addition,
Problem 4 models the opportunities of the EVs to participate in the PDR
market as discrete options, that is, the EV aggregator does not have to stay
in the market for the whole day, and it can plan to step out of market when
the PDR prices are not optimal. The actual monthly revenues from PDR mar-
kets illustrated by the red triangles in Fig. 16.7 where the varying flexibilities
of EV fleets to generate profits from PDR markets are shown. Note that the
consecutive commitment constraint is set to 1 hour for the PDR market
optimizations.