
Page 173 - Defrosting for Air Source Heat Pump
P. 173
Frosting evenness coefficient 167
installed multicircuit outdoor coil when its defrosting operation starts at different
FECs is very meaningful and fundamental.
As shown in Table 6.2, the results of the three experimental cases are listed in
detail. The total mass of frost accumulated was weighed at 878 g in Case 1, 894 g
in Case 2, and 881 g in Case 3. The three values are nearly the same, with the biggest
difference of 16 g, or just 1.8% (<10%), which makes the comparative study and
experimental results meaningful. In addition, in Case 1, the masses of frost accumu-
lated on each circuit’s surface were weighed at 301 g for Circuit 1, 316 g for Circuit 2,
and 261 g for Circuit 3, respectively. The FEC was calculated at about 82.6%. In Case
2, the frost accumulations from Circuit 1 to Circuit 3 were weighed at 280 g, 309 g,
and 305 g, respectively. The FEC was calculated at about 90.6%, which was about
8.0% higher than that in Case 1. As to Case 3, from Circuit 1 to Circuit 3, the frost
accumulations were weighed at 288 g, 298 g, and 295 g, respectively. The FEC in
Case 3 was calculated at about 96.6%, or 14.0% higher than that in Case 1.
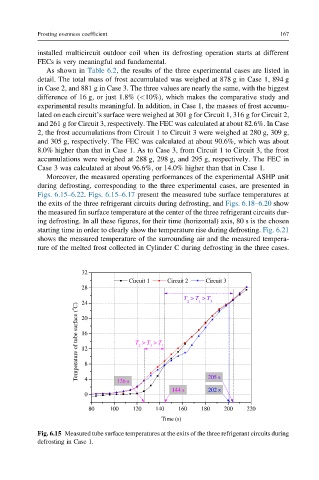
Moreover, the measured operating performances of the experimental ASHP unit
during defrosting, corresponding to the three experimental cases, are presented in
Figs. 6.15–6.22. Figs. 6.15–6.17 present the measured tube surface temperatures at
the exits of the three refrigerant circuits during defrosting, and Figs. 6.18–6.20 show
the measured fin surface temperature at the center of the three refrigerant circuits dur-
ing defrosting. In all these figures, for their time (horizontal) axis, 80 s is the chosen
starting time in order to clearly show the temperature rise during defrosting. Fig. 6.21
shows the measured temperature of the surrounding air and the measured tempera-
ture of the melted frost collected in Cylinder C during defrosting in the three cases.
32
Circuit 1 Circuit 2 Circuit 3
28
T > T > T 3
2
1
24
Temperature of tube surface ( o C) 16 8 T > T > T 1
20
2
3
12
4
126 s
202 s
144 s 205 s
0
80 100 120 140 160 180 200 220
Time (s)
Fig. 6.15 Measured tube surface temperatures at the exits of the three refrigerant circuits during
defrosting in Case 1.